As previously discussed, with mtg purchase apps down 10% from last year, and the % of cash buyers down as well, it’s hard to see how total sales can be anything but lower?
Existing Home Sales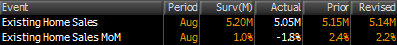
Highlights
In the latest disappointment out of the housing sector, existing home sales fell back 1.8 percent in August to a lower-than-expected annual rate of 5.05 million vs the Econoday consensus for 5.18 million. Year-on-year, sales are down 5.3 percent, a bit more steep than minus 4.5 percent in the prior month.
Limited supply has been a major factor holding down sales with supply on the market falling 40,000 homes in the month to 2.31 million. Supply relative to sales, at 5.5 months, held unchanged reflecting August’s sales dip.
Prices have been flat the last six months, down 0.8 percent in August to a median $219,800. Year-on-year, the median is little changed at plus 4.8 percent.
Looking at regional sales data, August’s weakness was centered in the West, down 6.0 percent, followed by the largest housing region which is the South, down 4.2 percent. The Northeast, which is the smallest region, shows a 4.7 percent gain with the Midwest up 2.5 percent.
The NAR reports:Existing-Home Sales Slightly Lose Momentum in August as Investor Activity Declines
Total existing-home sales, which are completed transactions that include single-family homes, townhomes, condominiums and co-ops, decreased 1.8 percent to a seasonally adjusted annual rate of 5.05 million in August from a slight downwardly-revised 5.14 million in July. Sales are at the second-highest pace of 2014, but remain 5.3 percent below the 5.33 million-unit level from last August, which was also the second-highest sales level of 2013. …
Total housing inventory at the end of August declined 1.7 percent to 2.31 million existing homes available for sale, which represents a 5.5-month supply at the current sales pace. However, unsold inventory is 4.5 percent higher than a year ago, when there were 2.21 million existing homes available for sale.

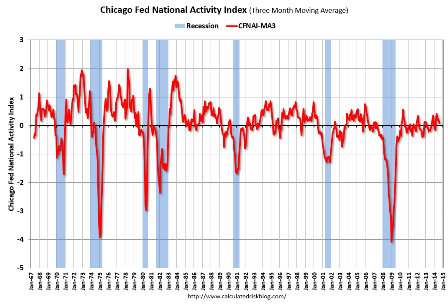
The Chicago Fed index was reported down a lot, and last month revised lower as well, but you pretty much only hear about this one when it goes up…

Highlights
A drop in production pulled down the national activity index in August, which came in at minus 0.21 from a revised plus 0.26 in July. The 3-month average is at plus 0.07 vs July’s revised plus 0.20.
The big negative in August was the 0.4 percent decline in the manufacturing component of the industrial production report, one that was likely skewed lower by timing issues for auto retooling. Consumption & housing also pulled down the main index, at minus 0.12 from July’s minus 0.13.
The employment component fell to zero from July’s plus 0.10 reflecting weak nonfarm payroll growth of 142,000. The component that had the best showing in August was sales/orders/inventories, at plus 0.08 vs plus 0.04 in July.