

The Hershey Company:
This Smart News Release features multimedia. View the full release here: http://www.businesswire.com/news/home/20160426005536/en/

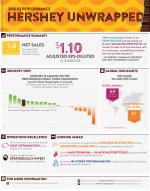
(Graphic: Business Wire)
- As expected, first-quarter net sales declined 5.6%; unfavorable foreign currency exchange rate a 1.2 point headwind, resulting in a constant currency net sales decline of 4.4%
- First-quarter earnings per share-diluted of $1.06 as reported and $1.10 adjusted
- Beginning in 2017, annual savings target from continuous improvement and productivity increased from about $50-70 million a year to about $100 million per year through 2019
- Outlook for 2016 updated:
- Constant currency net sales growth expected to be around 2.5%, including a net benefit from acquisitions, primarily barkTHINS, of about 0.5 points; unfavorable foreign currency exchange rates estimated to be a 1.0 point headwind
- Reported earnings per share-diluted expected to be in the $4.16 to $4.23 range
- Adjusted earnings per share-diluted expected to increase 3% to 4% and be in the $4.24 to $4.28 range
- Outlook includes barkTHINS dilution of $0.05 to $0.06 per share
The Hershey Company (NYSE: HSY) today announced sales and earnings for the first quarter ended April 3, 2016. Consolidated net sales were $1,828.8 million compared with $1,937.8 million for the first quarter of 2015. Reported net income for the first quarter of 2016 was $229.8 million or $1.06 per share-diluted, compared with $244.7 million or $1.10 per share-diluted for the comparable period of 2015.
“Our first-quarter efforts were focused on ensuring successful sell-in and sell through of Easter candy and making progress against strategic initiatives that are expected to benefit net sales and earnings growth over the remainder of the year,” said John P. Bilbrey, Chairman, President and Chief Executive Officer, The Hershey Company. “First-quarter net sales were relatively in line with our overall forecast and operating income was slightly ahead, driven by greater than expected productivity and cost savings. Easter performance was solid versus our forecast but non-seasonal candy, mint and gum (CMG) shipments were below plan. However, the non-seasonal softness was more than offset by the timing of some merchandising program net sales that occurred in the first quarter that were initially expected to ship in the second quarter. Our updated outlook for the full year reflects the modest non-seasonal CMG category and Hershey trends through the April year-to-date period. North America CMG investments, including new products, advertising, and increased levels of merchandising and display, are expected to accelerate in the second quarter and over the remainder of the year. Given the quality and level of these investments, there could be upside to our outlook if non-seasonal CMG marketplace performance is better than the first quarter trends. Building on our snacks strategy, today we announced that we purchased Ripple Brand Collective, LLC, a privately held company that owns the barkTHINS mass premium chocolate snacking brand. Since its launch in 2013, barkTHINS has quickly become a favorite snack brand due to its commitment to using simple ingredients, fair trade cocoa and non-GMO certification. barkTHINS is a very attractive and uniquely crafted brand that essentially created the chocolate 'thins' category, a new form of chocolate snacking. We look forward to building barkTHINS by leveraging Hershey’s scale at retail.”
Beginning in 2017, the company has increased its annual savings target from continuous improvement and productivity programs (CIP) from about $50 million to $70 million per year to about $100 million per year through 2019. CIP savings will be generated from cost optimization across all segments of the business and should enable the company to continue to invest in its brands while also delivering on its earnings objectives. Similar to prior years, the company expects that approximately two-thirds of the CIP savings will be generated by supply chain initiatives. Additionally, in 2016, the company expects to achieve incremental CIP savings of $10 million to $15 million.
As described in the Note below, for the first quarter of 2016, these results, prepared in accordance with U.S. generally accepted accounting principles (GAAP), included pre-tax charges of $54.4 million, or $0.16 per share-diluted. This was partially offset by a favorable settlement of the Shanghai Golden Monkey (SGM) liability related to the acquisition of $26.6 million, or $0.12 per share-diluted. Reported gross margin of 44.7% represented a decrease of 180 basis points versus the first quarter of 2015, due primarily to commodity derivative mark-to-market losses, while reported operating profit declined 13.9% to $339.5 million. For the first quarter of 2015, reported results included net pre-tax charges of $9.7 million, or $0.02 per share-diluted, which was more than offset by a gain on the sale of a trademark of $10.0 million, or $0.03 per share-diluted.
As previously communicated in the company’s fourth quarter earnings release, effective January 1, 2016, we are no longer electing to qualify commodity derivatives for hedge accounting treatment. Additionally, we have revised our definition of segment income and redefined non-GAAP income and earnings per share measures to exclude gains and losses on commodity derivatives until the related inventory is sold. We believe this change to our definition of segment income and non-GAAP income and non-GAAP earnings per share will continue to reflect the derivative gains and losses with the underlying exposure being hedged and thereby eliminate the mark-to-market volatility within our reported segment income as well as non-GAAP income and non-GAAP earnings per share.
The following table presents a summary of the charges in each period (see Appendix I for additional information):
| Pre-Tax (millions) | Earnings Per Share-Diluted | ||||||||||||||||||
| Three Months Ended | Three Months Ended | ||||||||||||||||||
| April 3, 2016 | April 5, 2015 | April 3, 2016 | April 5, 2015 | ||||||||||||||||
| Derivative Mark-to-Market Losses | $ | 34.9 | $ | — | $ | 0.10 | $ | — | |||||||||||
| Business Realignment Activities | 14.4 | 2.5 | 0.05 | 0.01 | |||||||||||||||
| Acquisition Integration Costs | — | 2.6 | — | 0.01 | |||||||||||||||
| Non-Service Related Pension Expense | 5.1 | 2.0 | 0.01 | — | |||||||||||||||
| Loss on Mauna Loa Divestiture | — | 2.7 | — | — | |||||||||||||||
| Settlement of SGM Liability | (26.6 | ) | — | (0.12 | ) | — | |||||||||||||
| Gain on Sale of Trademark | — | (10.0 | ) | — | (0.03 | ) | |||||||||||||
| $ | 27.8 | $ | (0.2 | ) | $ | 0.04 | $ | (0.01 | ) | ||||||||||
As described in the Note, adjusted net income, which excludes these net charges, was $238.9 million, or $1.10 per share-diluted, for the first quarter ended April 3, 2016, compared with $243.5 million, or $1.09 per share-diluted, for the same period of 2015, an increase of 0.9% in adjusted earnings per share-diluted.
In 2016, the company expects reported earnings per share-diluted of $4.16 to $4.23, including net pre-tax GAAP charges of approximately $0.05 to $0.08 per share-diluted. This projection, prepared in accordance with GAAP, assumes business realignment charges of $0.08 to $0.09 per share-diluted, non-service related pension expense (NSRPE) of $0.06 to $0.07 per share-diluted, net acquisition integration costs of $0.03 to $0.04 per share-diluted and a favorable settlement of the SGM liability of $0.12 per share-diluted.
First-Quarter Performance
Consolidated net sales were $1,828.8 million in the first quarter of 2016, a decline of 5.6% versus the first quarter of 2015. Excluding the effect of foreign currency translation, which was slightly greater than estimates and a 1.2 point headwind, net sales declined 4.4% versus the year ago period. Price realization on seasonal CMG products was more than offset by increased levels of direct trade resulting in a net price realization headwind of 0.5 points. Volume was off 4.3 points due to a shorter Easter season and anticipated lower sales in China. Net acquisitions and divestitures were a 0.4 point benefit.
Adjusted gross margin was 46.8% in the first quarter of 2016, compared to 46.6% in the first quarter of 2015. The 20 basis point increase was driven by greater than expected supply chain productivity and cost savings initiatives and slightly favorable commodity costs, partially offset by other supply chain costs.
Total advertising and related consumer marketing expense declined about 10% versus the first quarter of 2015 due to timing. North America new product launches, as well as merchandising and display activity, are expected to accelerate over the remainder of 2016 and be supported by advertising and related consumer marketing expense, which should increase at a percentage rate greater than net sales growth. Selling, marketing and administrative (SM&A) expenses, excluding advertising and related consumer marketing, declined about 9% in the quarter, driven by the aforementioned increase in our annual productivity and cost savings target as well as the initiative announced in June of 2015. In the first quarter of 2016, the company repurchased $303.9 million dollars of outstanding shares, resulting in diluted shares outstanding of 217.5 million, compared to 222.7 million in the first quarter of 2015.
Outlook
“Non-seasonal CMG results are anticipated to improve over the remainder of the year driven by greater levels of consumer programming and more effective brand support that should result in net sales, retail takeaway and market share growth," Bilbrey continued. "Where we have already made investments, results have been solid. Specifically, Reese's market share is up 0.4 points in 2016 driven by new and refreshed television and digital marketing campaigns. The company has many new products that will bring variety, news and excitement to the CMG category including, Reese’s Snack Mix, Hershey’s Snack Bites, Cadbury Chocolates targeting the mass premium market, Reese’s white minis, Kit Kat Big Kat, as well as other CMG items that should result in improving trends. Additionally, new advertising campaigns on many of our key brands, including Hershey’s, Kit Kat and Ice Breakers begin in the second quarter.”
The company estimates full-year 2016 net sales will increase around 1.5%, including a net benefit from acquisitions and divestitures of about 0.5 points. The company expects foreign currency exchange translation to have an unfavorable impact of approximately 1.0 percentage point on full-year net sales growth, resulting in an anticipated net sales increase of 2.5% on a constant currency basis. Excluding both unfavorable foreign currency exchange rates and the barkTHINS acquisition, full-year net sales are expected to increase about 2.0%. This is less than the previous estimate of about 3.0%, primarily due to lower than expected non-seasonal CMG growth over the remainder of the year. The company expects gross margin to be slightly below last year due primarily to unfavorable sales mix. The business productivity initiative announced in June and the incremental CIP savings are on track. As stated earlier, the company will continue to invest in advertising and related consumer marketing, including a greater shift to digital and mobile communications. As a result, the company expects adjusted earnings per share-diluted for 2016 to increase 3.0% to 4.0%, including barkTHINS dilution of $0.05 to $0.06 per share, and be in the $4.24 to $4.28 range.
Business Segment Results
The following are comments about segment performance for the first quarter of 2016 versus the year ago period. See the attached schedule of supplementary information for additional information on segment net sales and profit.
North America (U.S. & Canada)
Hershey’s North America net sales were $1,633.5 million in the first quarter of 2016, a decline of 4.3% versus the same period last year. Volume was off by approximately 3.7 points due primarily to a shorter Easter season. Price realization on seasonal CMG products was more than offset by increased levels of direct trade resulting in a net price realization headwind of 0.7 points. The combined Allan Candy and Krave acquisitions, as well as the Mauna Loa divestiture, were a 0.5 point benefit. Foreign exchange rates were 0.4 points unfavorable.
Hershey’s U.S. CMG retail takeaway for the 12 weeks ended March 26, 2016, in the expanded all outlet combined plus convenience store channels (xAOC+C-store), which accounts for approximately 90% of the company’s U.S. retail business, was up 8.2%, with market share off 0.1 points. This performance benefited from Easter being one week earlier in 2016. Therefore, April marketplace performance will be less than the year ago period and is expected to result in April year-to-date Hershey CMG retail sales of about the same as last year. In addition, Hershey’s and Reese’s snack mix items are not included in the CMG database as Nielsen captures this within salty snacks.
North America segment income declined 4.5% to $529.4 million in the first quarter of 2016, compared to $554.3 million in the first quarter of 2015. The decline in segment income was primarily driven by lower sales. North America advertising and related consumer marketing expense declined 6.6% versus the first quarter of 2015 due to timing.
International and Other
First-quarter net sales for Hershey’s International and Other segment declined 15.4% to $195.3 million, due primarily to lower net sales in China and the previously stated discontinuance of edible oil products in India. Unfavorable foreign currency exchange rates and the Mauna Loa divestiture were a 7.3 point and 0.7 point headwind, respectively. Net price realization was a 1.0 point benefit and volume was off 8.4 points. Combined first-quarter constant currency net sales in Mexico and Brazil increased nearly 6% driven by solid Hershey’s marketplace performance. As expected, China net sales declined about 35% in the first quarter of 2016 versus the year ago period as sell-in related to Chinese New Year items was lower than last year reflecting the challenging macroeconomic environment and continued competitive activity. In the first quarter of 2016, China chocolate category retail sales declined about 10%.
International and Other segment loss of $13.2 million compares to segment loss of $21.6 million in the first quarter of 2015. Combined income in Latin America and export markets improved versus last year and was more than offset by lower sales and unfavorable mix in China.
Unallocated Corporate Expense
Hershey’s unallocated adjusted corporate expense in the first quarter of 2016 was $122.2 million, a decline of $16.6 million versus last year primarily due to the implementation of the aforementioned productivity and cost savings initiatives.
Live Webcast
At 8:30 a.m. ET today, Hershey will host a conference call to elaborate on first-quarter results. To access this call as a webcast, please go to Hershey’s web site at http://www.thehersheycompany.com.
Note: In this release, Hershey references income measures that are not in accordance with GAAP because they exclude business realignment activities, goodwill and intangible asset impairment charges, acquisition integration costs, settlement of the SGM liability, the gain realized on the sale of a trademark, costs associated with the early extinguishment of debt, NSRPE and gains and losses associated with mark-to-market commodity derivatives. These non-GAAP financial measures are used in evaluating results of operations for internal purposes. These non-GAAP measures are not intended to replace the presentation of financial results in accordance with GAAP. Rather, the company believes exclusion of such items provides additional information to investors to facilitate the comparison of past and present operations. A reconciliation of the non-GAAP financial measures referenced in this release to their nearest comparable GAAP financial measure as presented in the Consolidated Statement of Income is provided below.
| Reconciliation of Certain Non-GAAP Financial Measures | |||||||||
| Consolidated results | Three Months Ended | ||||||||
| In thousands except per share data | April 3, 2016 | April 5, 2015 | |||||||
| Reported gross profit | $ | 817,376 | $ | 900,843 | |||||
| Derivative mark-to-market losses | 34,946 | — | |||||||
| Business realignment activities | (487 | ) | 1,348 | ||||||
| Acquisition integration costs | — | 134 | |||||||
| NSRPE | 3,241 | 761 | |||||||
| Non-GAAP gross profit | $ | 855,076 | $ | 903,086 | |||||
| Reported operating profit | $ | 339,509 | $ | 384,166 | |||||
| Derivative mark-to-market losses | 34,946 | — | |||||||
| Business realignment activities | 14,430 | 5,140 | |||||||
| Acquisition integration costs | — | 2,573 | |||||||
| NSRPE | 5,101 | 1,996 | |||||||
| Non-GAAP operating profit | $ | 393,986 | $ | 393,875 | |||||
| Reported provision for income taxes | $ | 109,897 | $ | 130,067 | |||||
| Derivative mark-to-market losses | 13,245 | — | |||||||
| Business realignment activities | 3,538 | 3,068 | |||||||
| Acquisition integration costs | — | 842 | |||||||
| NSRPE | 1,953 | 782 | |||||||
| Gain on sale of trademark | — | (3,662 | ) | ||||||
| Non-GAAP provision for income taxes | $ | 128,633 | $ | 131,097 | |||||
| Reported net income | $ | 229,832 | $ | 244,737 | |||||
| Derivative mark-to-market losses | 21,701 | — | |||||||
| Business realignment activities | 10,860 | 2,072 | |||||||
| Acquisition integration costs | — | 1,731 | |||||||
| NSRPE | 3,148 | 1,214 | |||||||
| Settlement of SGM liability | (26,650 | ) | — | ||||||
| Gain on sale of trademark | — | (6,288 | ) | ||||||
| Non-GAAP net income | $ | 238,891 | $ | 243,466 | |||||
| Reported EPS - Diluted | $ | 1.06 | $ | 1.10 | |||||
| Derivative mark-to-market losses | 0.10 | — | |||||||
| Business realignment activities | 0.05 | 0.01 | |||||||
| Acquisition integration costs | — | 0.01 | |||||||
| NSRPE | 0.01 | — | |||||||
| Settlement of SGM liability | (0.12 | ) | — | ||||||
| Gain on sale of trademark | — | (0.03 | ) | ||||||
| Non-GAAP EPS - Diluted | $ | 1.10 | $ | 1.09 | |||||
In the assessment of our results, we review and discuss the following financial metrics that are derived from the reported and non-GAAP financial measures presented above:
| Three Months Ended | |||||||
| April 3, 2016 | April 5, 2015 | ||||||
| As reported gross margin | 44.7 | % | 46.5 | % | |||
| Non-GAAP gross margin (1) | 46.8 | % | 46.6 | % | |||
| As reported operating profit margin | 18.6 | % | 19.8 | % | |||
| Non-GAAP operating profit margin (2) | 21.5 | % | 20.3 | % | |||
| As reported effective tax rate | 32.3 | % | 34.7 | % | |||
| Non-GAAP effective tax rate (3) | 35.0 | % | 35.0 | % | |||
| (1) | Calculated as non-GAAP gross profit as a percentage of net sales for each period presented. | |
| (2) | Calculated as non-GAAP operating profit as a percentage of net sales for each period presented. | |
| (3) | Calculated as non-GAAP provision for income taxes as a percentage of non-GAAP income before taxes (calculated as non-GAAP operating profit minus non-GAAP interest expense, net plus or minus non-GAAP other (income) expense, net). | |
We present certain percentage changes in net sales on a constant currency basis, which excludes the impact of foreign currency exchange. To present this information for historical periods, current period net sales for entities reporting in other than the U.S. dollar are translated into U.S. dollars at the average monthly exchange rates in effect during the corresponding period of the prior fiscal year, rather than at the actual average monthly exchange rates in effect during the current period of the current fiscal year. As a result, the foreign currency impact is equal to the current year results in local currencies multiplied by the change in average foreign currency exchange rate between the current fiscal period and the corresponding period of the prior fiscal year. A reconciliation between reported and constant currency growth rates is provided below:
| Three Months Ended April 3, 2016 | |||||||||||
| Impact of Foreign | Percentage Change | ||||||||||
| Percentage Change | Currency | on Constant | |||||||||
| as Reported | Exchange | Currency Basis | |||||||||
| North America segment | |||||||||||
| Canada | (7 | .3)% | (9 | .3)% | 2 | .0% | |||||
| Total North America segment | (4 | .3)% | (0 | .4)% | (3 | .9)% | |||||
| International and Other segment | |||||||||||
| Mexico | (13 | .8)% | (18 | .0)% | 4 | .2% | |||||
| Brazil | (21 | .8)% | (31 | .4)% | 9 | .6% | |||||
| India | (38 | .5)% | (5 | .1)% | (33 | .4)% | |||||
| Greater China | (39 | .2)% | (2 | .6)% | (36 | .6)% | |||||
| Total International and Other segment | (15 | .4)% | (7 | .3)% | (8 | .1)% | |||||
| Total Company | (5 | .6)% | (1 | .2)% | (4 | .4)% | |||||
We also present the percentage change in projected 2016 net sales on a constant currency basis. To determine this, projected 2016 net sales for entities reporting in currencies other than the U.S. dollar are translated into U.S. dollars at the company's average monthly exchange rates in effect during the corresponding period of the prior fiscal year, and are compared to the 2015 results translated into U.S. dollars using the same 2015 average monthly exchange rates.
Below is a reconciliation of full-year 2015 and projected 2016 earnings per share-diluted calculated in accordance with GAAP to non-GAAP adjusted earnings per share-diluted:
| 2015 | 2016 (Projected) | ||||
| Reported EPS - Diluted | $2.32 | $4.16 – $4.23 | |||
| Business Realignment Activities | 0.36 | 0.08 – 0.09 | |||
| Acquisition Integration Costs | 0.05 | 0.03 – 0.04 | |||
| NSRPE | 0.05 | 0.06 – 0.07 | |||
| Settlement of SGM liability | — | (0.12) | |||
| Goodwill / Intangible Asset Impairment | 1.28 | – – | |||
| Loss on Early Extinguishment of Debt | 0.09 | – – | |||
| Gain on Sale of Trademark | (0.03) | – | |||
| Adjusted EPS - Diluted | $4.12 | $4.24 – $4.28 | |||
Our 2016 projected earnings per share-diluted, as presented above, does not include the impact of mark-to-market gains and losses on our commodity derivative contracts that will be reflected within corporate unallocated expenses in our segment results until the related inventory is sold, under our revised accounting policy for commodity derivatives.
Appendix I
Details of the charges included in GAAP results, as summarized in the press release (above), are as follows:
Business Realignment Activities: We periodically undertake restructuring and cost reduction activities as part of ongoing efforts to enhance long-term profitability. During the first quarter of 2016, we began the process of optimizing the China business and workforce structure. We incurred initial costs relating primarily to severance and other third party charges in connection with these activities. In addition, we made minor revisions to severance benefits and related costs in connection with the productivity initiative announced in June 2015. Charges in 2015 relate primarily to programs that commenced in 2014 to rationalize certain non-U.S. manufacturing and distribution activities.
Settlement of Shanghai Golden Monkey (SGM) liability
In the fourth quarter of 2015, we reached an agreement with the SGM selling shareholders to reduce the originally-agreed purchase price for the remaining 20% of SGM, and we completed the purchase on February 3, 2016. In the first quarter of 2016, we recorded a $26.7 million gain relating to the settlement of the SGM liability, representing the net carrying amount of the recorded liability in excess of the cash paid to settle the obligation for the remaining 20% of the outstanding shares.
Acquisition Integration Costs: We have incurred costs related to the integration of the 2014 acquisitions of SGM and Allan Candy and the 2015 acquisition of Krave as we incorporate these businesses into our operating practices and information systems.
Non-Service Related Pension Expense: Non-service related pension expense (NSRPE) includes interest costs, the expected return on pension plan assets, the amortization of actuarial gains and losses, and certain curtailment and settlement losses or credits. The NSRPE can fluctuate from year-to-year as a result of changes in market interest rates and market returns on pension plan assets. We believe that the service cost component of our total pension benefit costs closely reflects the operating costs of our business and provides for a better comparison of our operating results from year-to-year. Therefore, we exclude the NSRPE from our internal performance measures. Our most significant defined benefit pension plans were closed to most new participants in 2007, resulting in ongoing service costs that are stable and predictable.
Goodwill Impairment: As disclosed in 2015, we recorded a non-cash impairment charge relating to the goodwill generated by the SGM acquisition.
Loss on Early Extinguishment of Debt: During the third quarter of 2015, we recorded within interest expense a pre-tax loss on early extinguishment of debt relating to a cash tender offer.
Gain on Sale of Trademark: During the first quarter of 2015, we recorded a gain related to the sale of a non-core trademark.
Mark-to-Market Losses (Gains) on Commodity Derivatives
Commensurate with our discontinuance of hedge accounting treatment for commodity derivatives, we are adjusting the mark-to-market losses (gains) on such commodity derivatives, until such time as the related inventory is sold. Since we often purchase commodity contracts to price inventory requirements in future years, we make this adjustment to facilitate the year-over-year comparison of cost of sales on a basis that reflects the derivative gains and losses with the underlying economic exposure being hedged for the period.
Safe Harbor Statement
This release contains forward-looking statements within the meaning of the Private Securities Litigation Reform Act of 1995. Many of these forward-looking statements can be identified by the use of words such as “intend,” “believe,” “expect,” “anticipate,” “should,” “planned,” “projected,” “estimated,” and “potential,” among others. These statements are made based upon current expectations that are subject to risk and uncertainty. Because actual results may differ materially from those contained in the forward-looking statements, you should not place undue reliance on the forward-looking statements when deciding whether to buy, sell or hold the company's securities. Factors that could cause results to differ materially include, but are not limited to: issues or concerns related to the quality and safety of our products, ingredients or packaging; changes in raw material and other costs, along with the availability of adequate supplies of raw materials; selling price increases, including volume declines associated with pricing elasticity; market demand for our new and existing products; increased marketplace competition; disruption to our manufacturing operations or supply chain; failure to successfully execute and integrate acquisitions, divestitures and joint ventures; changes in governmental laws and regulations, including taxes; political, economic, and/or financial market conditions; risks and uncertainties related to our international operations; disruptions, failures or security breaches of our information technology infrastructure; our ability to hire, engage and retain a talented global workforce; and such other matters as discussed in our Annual Report on Form 10-K for the year ended December 31, 2015. All information in this press release is as of April 26, 2016. The company undertakes no duty to update any forward-looking statement to conform the statement to actual results or changes in the company's expectations.
| The Hershey Company | |||||||||||||
| Consolidated Statements of Income | |||||||||||||
| for the three months ended April 3, 2016 and April 5, 2015 | |||||||||||||
| (unaudited) (in thousands except per share amounts) | |||||||||||||
| First Quarter | |||||||||||||
| 2016 | 2015 | ||||||||||||
| Net sales | $ | 1,828,812 | $ | 1,937,800 | |||||||||
| Costs and expenses: | |||||||||||||
| Cost of sales | 1,011,436 | 1,036,957 | |||||||||||
| Selling, marketing and administrative | 471,734 | 514,010 | |||||||||||
| Business realignment charges | 6,133 | 2,667 | |||||||||||
| Total costs and expenses | 1,489,303 | 1,553,634 | |||||||||||
| Operating profit | 339,509 | 384,166 | |||||||||||
| Interest expense, net | 21,005 | 19,202 | |||||||||||
| Other (income) expense, net | (21,225 | ) | (9,840 | ) | |||||||||
| Income before income taxes | 339,729 | 374,804 | |||||||||||
| Provision for income taxes | 109,897 | 130,067 | |||||||||||
| Net income | $ | 229,832 | $ | 244,737 | |||||||||
Net income per share | - Basic | - Common | $ | 1.09 | $ | 1.14 | |||||||
- Diluted | - Common | $ | 1.06 | $ | 1.10 | ||||||||
- Basic | - Class B | $ | 0.99 | $ | 1.04 | ||||||||
Shares outstanding | - Basic | - Common | 155,675 | 160,024 | |||||||||
- Diluted | - Common | 217,487 | 222,719 | ||||||||||
- Basic | - Class B | 60,620 | 60,620 | ||||||||||
| Key margins: | |||||||||||||
| Gross margin | 44.7 | % | 46.5 | % | |||||||||
| Operating profit margin | 18.6 | % | 19.8 | % | |||||||||
| Net margin | 12.6 | % | 12.6 | % | |||||||||
| The Hershey Company | ||||||||||||||
| Supplementary Information – Segment Results | ||||||||||||||
| for the three months ended April 3, 2016 and April 5, 2015 | ||||||||||||||
| (unaudited) (in thousands of dollars) | ||||||||||||||
| First Quarter | ||||||||||||||
| 2016 | 2015 | % Change | ||||||||||||
| Net sales: | ||||||||||||||
| North America | $ | 1,633,471 | $ | 1,706,995 | (4.3 | )% | ||||||||
| International and Other | 195,341 | 230,805 | (15.4 | )% | ||||||||||
| Total | $ | 1,828,812 | $ | 1,937,800 | (5.6 | )% | ||||||||
| Segment income (loss): | ||||||||||||||
| North America | $ | 529,390 | $ | 554,306 | (4.5 | )% | ||||||||
| International and Other | (13,233 | ) | (21,759 | ) | 39.2 | % | ||||||||
| Total segment income | 516,157 | 532,547 | (3.1 | )% | ||||||||||
| Unallocated corporate expense (1) | 122,171 | 138,672 | (11.9 | )% | ||||||||||
| Mark-to-market adjustment for commodity derivatives (2) | 34,946 | — | NM | |||||||||||
| Charges associated with business realignment initiatives | 14,430 | 5,140 | 180.7 | % | ||||||||||
| Non-service related pension | 5,101 | 1,996 | 155.6 | % | ||||||||||
| Acquisition integration costs | — | 2,573 | (100.0 | )% | ||||||||||
| Operating profit | 339,509 | 384,166 | (11.6 | )% | ||||||||||
| Interest expense, net | 21,005 | 19,202 | 9.4 | % | ||||||||||
| Other (income) expense, net | (21,225 | ) | (9,840 | ) | 115.7 | % | ||||||||
| Income before income taxes | $ | 339,729 | $ | 374,804 | (9.4 | )% | ||||||||
(1) | Includes centrally-managed (a) corporate functional costs relating to legal, treasury, finance, and human resources, (b) expenses associated with the oversight and administration of our global operations, including warehousing, distribution and manufacturing, information systems and global shared services, (c) non-cash stock-based compensation expense, and (d) other gains or losses that are not integral to segment performance. | |
(2) | Includes gains and losses on commodity derivative instruments which have been excluded from segment income until the related inventory is sold. | |
NM - not meaningful | ||
| First Quarter | ||||||||
| 2016 | 2015 | |||||||
| Segment income as a percent of net sales: | ||||||||
| North America | 32.4 | % | 32.5 | % | ||||
| International and Other | (6.8 | )% | (9.4 | )% | ||||
| The Hershey Company | ||||||||
| Consolidated Balance Sheets | ||||||||
| as of April 3, 2016 and December 31, 2015 | ||||||||
| (in thousands of dollars) | ||||||||
Assets | 2016 | 2015 | ||||||
| (unaudited) | ||||||||
| Cash and cash equivalents | $ | 285,958 | $ | 346,529 | ||||
| Accounts receivable - trade, net | 544,027 | 599,073 | ||||||
| Inventories | 770,382 | 750,970 | ||||||
| Prepaid expenses and other | 172,551 | 152,026 | ||||||
| Total current assets | 1,772,918 | 1,848,598 | ||||||
| Property, plant and equipment, net | 2,230,071 | 2,240,460 | ||||||
| Goodwill | 690,654 | 684,252 | ||||||
| Other intangibles | 375,309 | 379,305 | ||||||
| Other assets | 185,104 | 155,366 | ||||||
| Deferred income taxes | 51,784 | 36,390 | ||||||
| Total assets | $ | 5,305,840 | $ | 5,344,371 | ||||
Liabilities and Stockholders' Equity | ||||||||
| Accounts payable | $ | 436,343 | $ | 474,266 | ||||
| Accrued liabilities | 769,793 | 856,967 | ||||||
| Accrued income taxes | 110,256 | 23,243 | ||||||
| Short-term debt | 520,564 | 363,513 | ||||||
| Current portion of long-term debt | 500,016 | 499,923 | ||||||
| Total current liabilities | 2,336,972 | 2,217,912 | ||||||
| Long-term debt | 1,571,388 | 1,557,091 | ||||||
| Other long-term liabilities | 465,523 | 468,718 | ||||||
| Deferred income taxes | 52,604 | 53,188 | ||||||
| Total liabilities | 4,426,487 | 4,296,909 | ||||||
| Total stockholders' equity | 879,353 | 1,047,462 | ||||||
| Total liabilities and stockholders' equity | $ | 5,305,840 | $ | 5,344,371 | ||||
View source version on businesswire.com: http://www.businesswire.com/news/home/20160426005536/en/
Contacts:
FINANCIAL CONTACT:
Mark
Pogharian, 717-534-7556
or
MEDIA CONTACT:
Jennifer
Sniderman, 717-534-6275
