
Still up from last year this time but seem stalled out at relatively low levels and Q2 not any better than Q1:
United States : MBA Mortgage Applications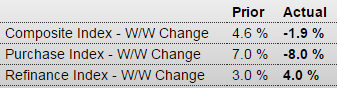
Highlights
Weekly data are often volatile and it’s hard making much of the last two weeks of purchase applications data which plunged 8.0 percent in the July 10 week after spiking 7.0 percent in the prior week. Put together, the purchase index has slipped 1.4 percent in the two weeks which is a negative signal for home purchases. The refinance index rose 4 percent in the week. Rates were little changed in the week with the average 30-year mortgage for conforming loans ($417,000 or less) unchanged at 4.23 percent.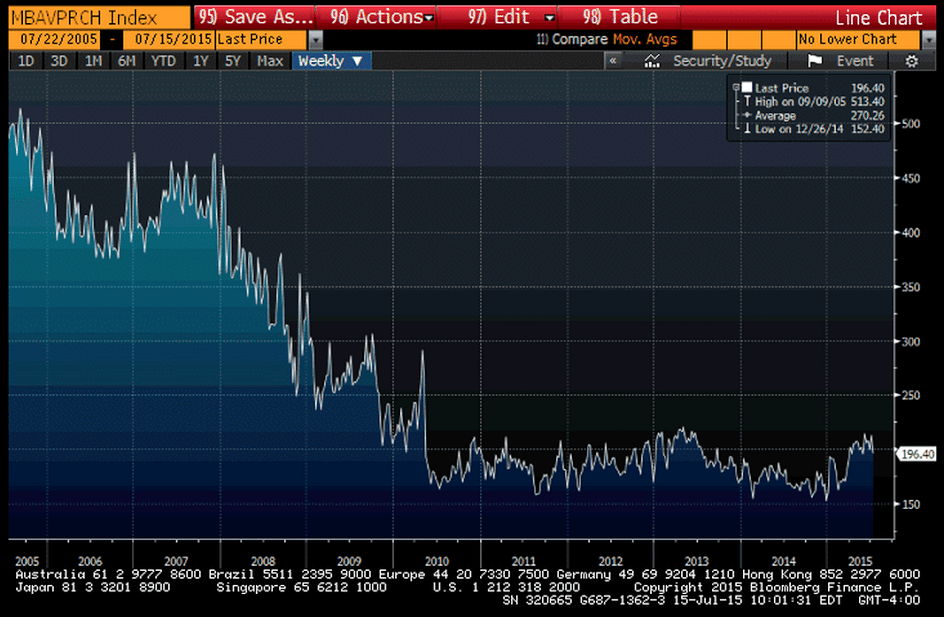
Not encouraging and yet another reference to weak US exports:
United States : Empire State Mfg Survey![]()
Highlights
The manufacturing sector isn’t picking up any steam this month based on the Empire State index which came in only just above zero, at 3.86. The new orders index, ominously, is in negative ground at minus 3.50. This is the fourth negative reading in five months for new orders which points squarely at slowing overall activity in the months ahead.
And hiring this month has slowed, to 3.19 vs June’s 8.65 in yet another soft signal. Price data show moderation for inputs at 7.45 vs 9.62. One plus in the report is a slight uptick in the 6-month outlook to 27.04 vs 25.84.
Hit by weak exports, the manufacturing sector is dragging down U.S. growth. Watch Thursday for the Philly Fed report for July which, in what may prove to be an outlier, showed surprising strength in June.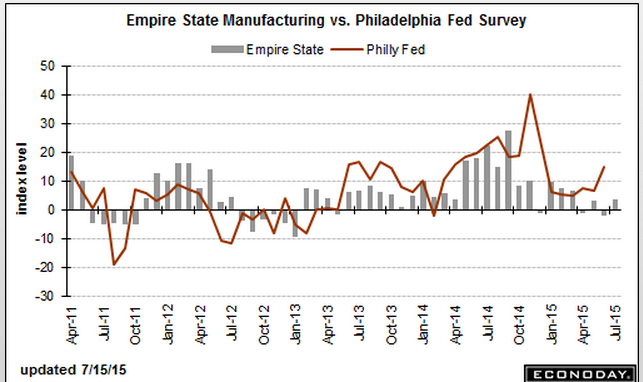
Not good, and another reference to weak US exports:
United States : Industrial Production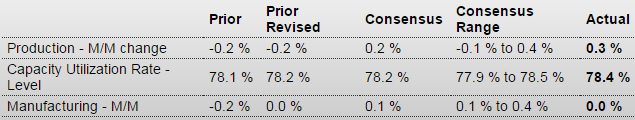
Highlights
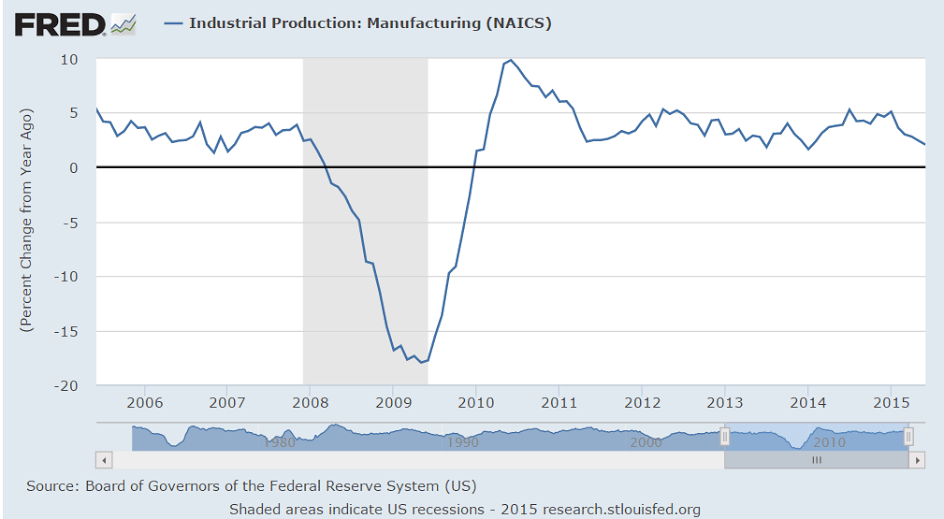
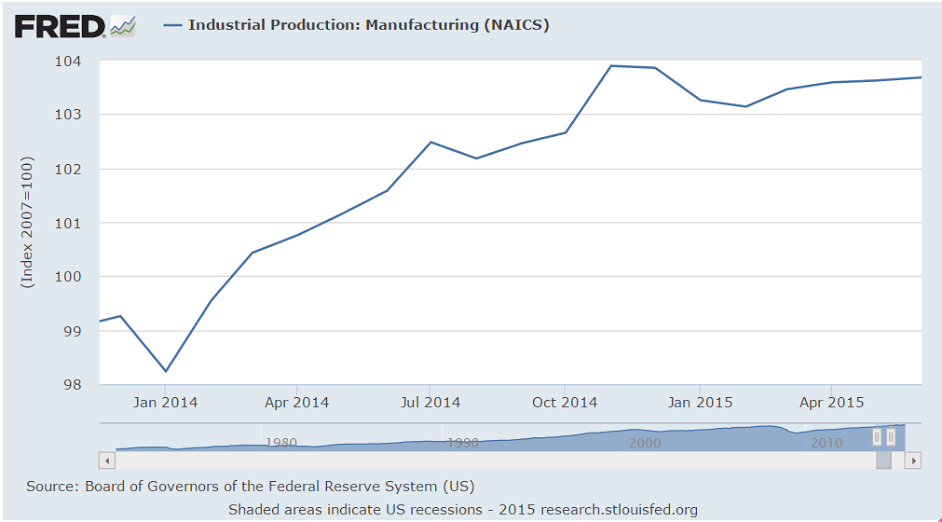
A plus 0.3 percent rise in June industrial production looks respectable but still overstates strength. The gain follows two prior months of sizable contraction, at minus 0.2 percent and minus 0.5 percent, and reflects a jump higher for utilities and for mining. Manufacturing, and the key component for the series, is unchanged for a second straight month — truly dead in the water at a year-on-year rate of only plus 1.8 percent.
Motor vehicle production is very weak in the June report, down 3.7 percent and more than offsetting a 0.8 percent rise for hi-tech production, a 0.7 percent gain for chemicals, and a 1.4 percent jump for furniture. Retail sales of vehicles surged back in May but turned lower in June which doesn’t point to much of a rebound for vehicle production later this summer.
One sign of strength is a 2 tenths uptick in the overall capacity utilization rate to 78.4 percent. But here too, the gain reflects gains for utilities and mining and not manufacturing where capacity utilization actually fell 1 tenth to 77.2 percent.
This report offers the first conclusive data on the manufacturing sector during June while this morning’s earlier release of the Empire State report offers the first anecdotal look at July. And the verdict? A manufacturing sector that is being hurt by weakness in exports and that’s dragging down the economy’s growth.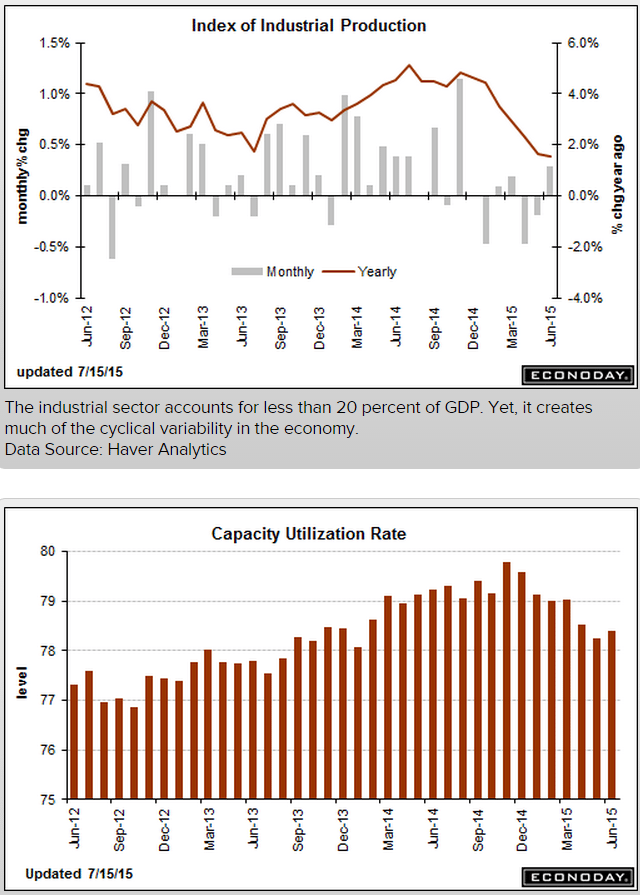
The post mtg purch apps, Empire survey, industrial production appeared first on The Center of the Universe.
