
 ( click to enlarge )
This stock is part of my portfolio and I intend to stay with it. We are on the verge of a possible range breakout in the shares of VirnetX Holding Corporation (NYSEMKT:VHC). The breakout could happen any day. The technical chart above shows very bullish sign as the stock is on top of short-term EMAs with 20-day EMA also on top of 50-day EMA. In addition, MACD remains bullish while ADX is gaining momentum and is starting to signal the beginning of a trending change. Relative Strength Index (RSI) is also moving higher, which is a sign of growing strength in the stock. Still holding my long position. If it breaks the trading range, $10 is the first target.
 ( click to enlarge )
ITT Educational Services, Inc.(NYSE:ESI) The new bullish trend looks good. Key resistance is located at 8.55 (DT), a break above this level will confirm the bullish trend and the following uptrend will take price up to 10.85/11 zone. Momentum picking up with MACD climbing and RSI rising.
 ( click to enlarge )
DARA Biosciences Inc (NASDAQ:DARA) is a bottom play trying to make a shift in trend. From a technical perspective, the stock shows a bullish divergence on MACD. To return to rally mode, the stock price needs to cross its short-term resistance at 86c. A move above this level would be positive for the stock. A reversal above 86 will take the stock higher to $1 or $1.05.
 ( click to enlarge )
Facebook Inc (NASDAQ:FB) Broke out today on decent volume. Look for follow through tomorrow. Today’s high was $79,84, which is resistance for the continuation move on Friday. MACD is now positive and above the signal line. RSI is moving up and above its 50% level.
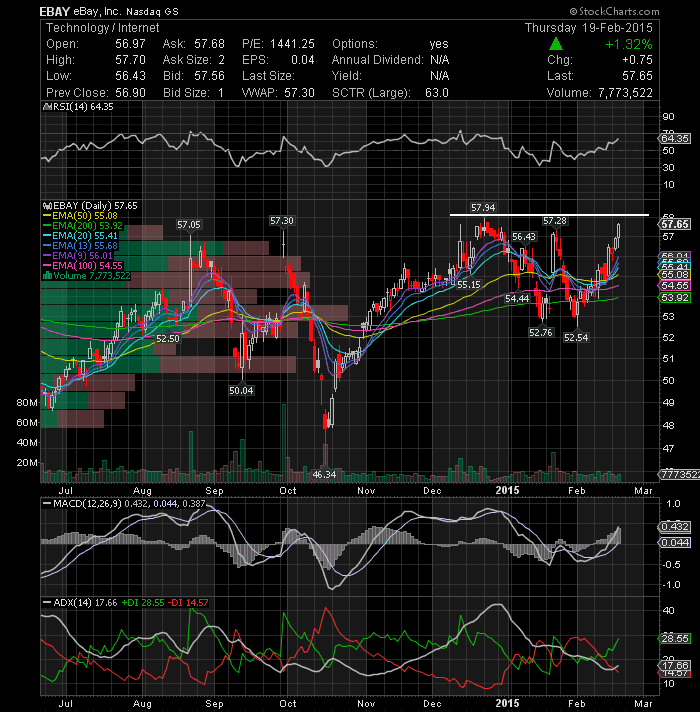 ( click to enlarge )
eBay Inc (NASDAQ:EBAY) is strong and getting stronger every day it seems. If the stock can close above $57.94 tomorrow, then expect more upside. If this happens, EBAY is a good play. As long as the stock stays above the 9-day EMA, the short-term bullish scenario still intact. Technical chart shows very strong bullish sign. MACD indicator is rising above zero, indicating a buy.
 ( click to enlarge )
Shares of Hologic, Inc.(NASDAQ:HOLX) today broke out of a bullish consolidation pattern that has been a pause in its steep, more than 23% up move in January. If the stock can break today’s high of $31.80, we should see a strong follow through move. HOLX will move very quickly, so keep a very close eye on the stock.
During the day I tweet many times to my readers. I encourage everybody to subscribe AC Investor Blog twitter and newsletter, so you can receive my trade ideas and stock news in real time.
Disclaimer : This is not an investment advisory, and should not be used to make investment decisions. Information in AC Investor Blog is often opinionated and should be considered for information purposes only. No stock exchange anywhere has approved or disapproved of the information contained herein. There is no express or implied solicitation to buy or sell securities. The charts provided here are not meant for investment purposes and only serve as technical examples. Don't consider buying or selling any stock without conducting your own due diligence.
Thanks for visiting AC Investor Blog.
AC
