

Here's a VERY easy prediction to make.
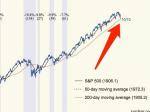
This week, lots of people are going to be talking about the red line in the chart above. That's the 200-day moving average (the average of the last 200 days of trading). When the stock market falls below that line, people start to freak out about a serious correction. Right now, the market is bang-on the line, so what stocks do next (will they bounce off the line? Will they slice right through it?) will be a major source of conversation.
See Also:
