Year over year:
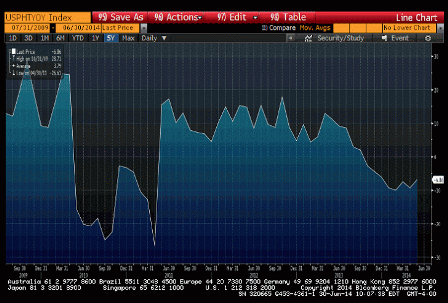
Monthly:
So far, not seasonally adjusted first 5 months this year down about 8.4% from first 5 months last year.

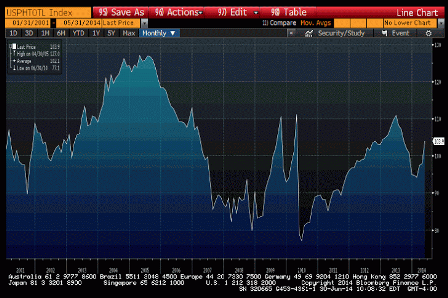
Year over year:
Monthly:
So far, not seasonally adjusted first 5 months this year down about 8.4% from first 5 months last year.
