

Tenneco (NYSE: TEN) reported first quarter net income of $57 million, or 99-cents per diluted share, compared with $49 million, or 80-cents per diluted share in first quarter 2015. Adjusted net income rose 24% to a first quarter record high of $67 million, or $1.17 per diluted share, versus $54 million or 88-cents per diluted share last year, a 33% improvement in adjusted earnings per share.
This Smart News Release features multimedia. View the full release here: http://www.businesswire.com/news/home/20160426005934/en/

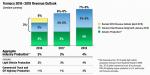
Tenneco raises full-year 2016 revenue outlook. (Graphic: Business Wire)
Revenue
Total revenue in the first quarter was $2.136 billion, up 6% year-over-year. Excluding a negative currency impact of $69 million, total first quarter revenue increased 9% to $2.205 billion. Tenneco’s total revenue excluding currency significantly outgrew global aggregate industry production growth of 1% in the quarter driven by light vehicle revenue growth of 11%, led by North America, Europe, China and India; commercial truck and off-highway revenue growth of 1%; and an 8% increase in global aftermarket revenue on higher sales in Europe, South America and North America.
“We are off to a strong start for the year with outstanding first quarter results including strong revenue growth, record-high earnings, and our twelfth consecutive quarter of margin improvement,” said Gregg Sherrill, chairman and CEO, Tenneco. “In addition to delivering on our growth plans, we drove higher earnings and improved margins with a disciplined approach to improving manufacturing efficiency and lowering our cost structure. This consistent quarterly performance demonstrates solid execution on our strategies for achieving profitable growth while continuing to plan and invest for the future.”
EBIT
First quarter EBIT (earnings before interest, taxes and noncontrolling interests) increased to $124 million, versus $120 million last year. Adjusted EBIT rose 10% to $138 million, a record high for the first quarter. Adjusted EBIT includes $12 million in negative currency. The record-high first quarter EBIT was driven by strong light vehicle volumes, commercial truck and off-highway clean air content growth, higher global aftermarket sales and operational cost improvements.
Adjusted first quarter 2016 and 2015 results | ||||||||||||||||||||||||||
| (millions except per share amounts) | Q1 2016 | Q1 2015 | ||||||||||||||||||||||||
| EBITDA* | EBIT | Net income attributable to Tenneco Inc. | Per Share | EBITDA* | EBIT | Net income attributable to Tenneco Inc. | Per Share | |||||||||||||||||||
| Earnings Measures | $ | 178 | $ | 124 | $ | 57 | $ | 0.99 | $ | 170 | $ | 120 | $ | 49 | $ | 0.80 | ||||||||||
| Adjustments (reflects non-GAAP measures): | ||||||||||||||||||||||||||
| Restructuring and related expenses | 11 | 14 | 13 | 0.23 | 5 | 5 | 4 | 0.07 | ||||||||||||||||||
| Net tax adjustments | - | - | (3 | ) | (0.05 | ) | - | - | 1 | 0.01 | ||||||||||||||||
| Non-GAAP earnings measures | $ | 189 | $ | 138 | $ | 67 | $ | 1.17 | $ | 175 | $ | 125 | $ | 54 | $ | 0.88 | ||||||||||
| * EBITDA including noncontrolling interests (EBIT before depreciation and amortization) | ||||||||||||||||||||||||||
| In addition to the items set forth above, the tables at the end of this press release reconcile GAAP to non-GAAP results. | ||||||||||||||||||||||||||
First quarter EBIT margin
In the first quarter 2016, Tenneco delivered its twelfth consecutive quarter of value-add adjusted EBIT margin improvement with higher margins in both product lines.
| Q1 2016 | Q1 2015 | ||||
| EBIT as a percent of revenue | 5.8% | 5.9% | |||
| EBIT as a percent of value-add revenue | 7.6% | 7.7% | |||
| Adjusted EBIT as a percent of revenue | 6.5% | 6.2% | |||
| Adjusted EBIT as a percent of value-add revenue | 8.5% | 8.0% |
Clean Air adjusted EBIT as a percent of value-add revenue was up 110 basis points to 11%, driven by higher light vehicle volumes and new platform launches, as well as commercial truck and off-highway content growth and higher aftermarket revenue in North America. Ride Performance adjusted EBIT margin improved 100 basis points to 10.1%, driven by stronger light vehicle volumes in Europe, India and China and higher aftermarket sales in Europe, South America and North America. Both Clean Air and Ride Performance margins include the benefit of operational cost improvements.
Cash
Cash used by operations in the quarter was $29 million, a 42% improvement compared with a cash use of $50 million a year ago. The improvement was driven by higher earnings and strong working capital management.
During the quarter the company repurchased 360,000 shares of common stock for $16 million. Since January 1, 2015, the company has repurchased a total of 4.6 million shares of common stock for $229 million.
OUTLOOK
Second quarter 2016
Tenneco expects total revenue growth of 6% in the second quarter 2016 (excluding currency), outpacing estimated aggregate industry production growth of 4%* which includes an increase in light vehicle industry production of 4% and a 1% decline in combined commercial truck and off-highway industry production.
Based on current exchange rates, the company anticipates no significant currency headwinds in the second quarter.
Tenneco’s expected 6% revenue increase will be driven by stronger global light vehicle volumes including new launches and the ramp up on recently launched platforms, and a solid contribution from the global aftermarket. Commercial truck and off-highway revenue is expected to be roughly in line with industry production.
The company also expects continued margin improvement in the second quarter.
Revised Full Year Revenue Outlook
Tenneco is upwardly revising its revenue guidance for the full year. The company now expects to outgrow global industry production by 3 percentage points, resulting in annual revenue growth of 6 percent, excluding currency based on current aggregate industry production estimates.
“Given our first quarter results and based on what we see in the markets today, we expect to deliver full year revenue growth that exceeds industry production by 3%. Looking beyond this year, we see our growth accelerating in both 2017 and 2018 primarily due to new light vehicle emissions regulations beginning to take effect in North America and Europe,” said Sherrill. “We also expect continued margin improvement as we leverage higher volumes and execute on our operational improvement initiatives.”
*Aggregate Industry Production: IHS Automotive April 2016 global light vehicle production forecasts, Power Systems Research (PSR), April 2016 forecast for global commercial truck and buses and PSR off-highway engine production in North America and Europe and Tenneco estimates.
Attachment 1 |
| Statements of Income – 3 Months |
| Balance Sheets |
| Statements of Cash Flows – 3 Months |
Attachment 2 |
| Reconciliation of GAAP Net Income to EBITDA including noncontrolling interests – 3 Months |
| Reconciliation of GAAP to Non-GAAP Earnings Measures – 3 Months |
| Reconciliation of GAAP Revenue to Non-GAAP Revenue Measures – 3 Months |
| Reconciliation of GAAP Revenue to Non-GAAP Revenue Measures – 3 Months |
| Reconciliation of Non-GAAP Measures – Debt Net of Cash/Adjusted LTM EBITDA including noncontrolling interests |
| Reconciliation of GAAP Revenue to Non-GAAP Revenue Measures – Original Equipment and Aftermarket Revenue – 3 Months |
| Reconciliation of GAAP Revenue and Earnings to Non-GAAP Revenue and Earnings Measures – 3 Months |
| Reconciliation of GAAP Revenue to Non-GAAP Revenue Measures – Original Equipment Commercial Truck, Off-Highway and other revenues – 3 Months |
CONFERENCE CALL
The company will host a conference call on Tuesday, April 26, 2016 at 9:00 a.m. ET. The dial-in number is 800-988-9663 (domestic) or 517-308-9192 (international). The passcode is TENNECO. The call and accompanying slides will be available on the financial section of the Tenneco web site at www.tenneco.com. A recording of the call will be available one hour following completion of the call on April 26, 2016 through May 26, 2016. To access this recording, dial 866-481-4961 (domestic) or 203-369-1557 (international). The purpose of the call is to discuss the company’s operations for the first fiscal quarter of 2016, as well as provide updated information regarding matters impacting the company’s outlook. A copy of the press release is available on the financial and news sections of the Tenneco web site.
ANNUAL MEETING
The Tenneco Board of Directors has scheduled the corporation’s annual meeting of shareholders for Wednesday, May 18, 2016 at 10:00 a.m. CT. The meeting will be held at the corporate headquarters, 500 North Field Drive, Lake Forest, Illinois.
Tenneco is an $8.2 billion global manufacturing company with headquarters in Lake Forest, Illinois and approximately 30,000 employees worldwide. Tenneco is one of the world’s largest designers, manufacturers and marketers of clean air and ride performance products and systems for automotive and commercial vehicle original equipment markets and the aftermarket. Tenneco’s principal brand names are Monroe®, Walker®, XNOx™ and Clevite®Elastomers.
Revenue estimates in this release are based on OE manufacturers’ programs that have been formally awarded to the company; programs where Tenneco is highly confident that it will be awarded business based on informal customer indications consistent with past practices; and Tenneco’s status as supplier for the existing program and its relationship with the customer. These revenue estimates are also based on anticipated vehicle production levels and pricing, including precious metals pricing and the impact of material cost changes. For certain additional assumptions upon which these estimates are based, see the slides accompanying the April 26, 2016 webcast, which will be available on the financial section of the Tenneco website at www.tenneco.com.
This press release contains forward-looking statements. Words such as “may,” “expects,” “anticipate,” ”projects,” “will,” “outlook” and similar expressions identify forward-looking statements. These forward-looking statements are based on the current expectations of the company (including its subsidiaries). Because these forward-looking statements involve risks and uncertainties, the company's plans, actions and actual results could differ materially. Among the factors that could cause these plans, actions and results to differ materially from current expectations are:
(i) general economic, business and market conditions;
(ii) the company’s ability to source and procure needed materials, components and other products and services in accordance with customer demand and at competitive prices;
(iii) the cost and outcome of existing and any future claims, legal proceedings, or investigations, including, but not limited to, any of the foregoing arising in connection with the ongoing global antitrust investigation, product performance, product safety or intellectual property rights;
(iv) changes in capital availability or costs, including increases in the company's costs of borrowing (i.e., interest rate increases), the amount of the company's debt, the ability of the company to access capital markets at favorable rates, and the credit ratings of the company’s debt;
(v) changes in consumer demand, prices and the company’s ability to have our products included on top selling vehicles, including any shifts in consumer preferences to lower margin vehicles, for which we may or may not have supply arrangements;
(vi) changes in automotive and commercial vehicle manufacturers' production rates and their actual and forecasted requirements for the company's products such as the significant production cuts during recent years by automotive manufacturers in response to difficult economic conditions;
(vii) the overall highly competitive nature of the automobile and commercial vehicle parts industries, and any resultant inability to realize the sales represented by the company’s awarded book of business which is based on anticipated pricing and volumes over the life of the applicable program;
(viii) the loss of any of our large original equipment manufacturer (“OEM”) customers (on whom we depend for a substantial portion of our revenues), or the loss of market shares by these customers if we are unable to achieve increased sales to other OEMs or any change in customer demand due to delays in the adoption or enforcement of worldwide emissions regulations;
(ix) the company's continued success in cost reduction and cash management programs and its ability to execute restructuring and other cost reduction plans, including our current European cost reduction initiatives, and to realize anticipated benefits from these plans;
(x) economic, exchange rate and political conditions in the countries where we operate or sell our products;
(xi) workforce factors such as strikes or labor interruptions;
(xii) increases in the costs of raw materials, including the company’s ability to successfully reduce the impact of any such cost increases through materials substitutions, cost reduction initiatives, customer recovery and other methods;
(xiii) the negative impact of fuel price volatility on transportation and logistics costs, raw material costs, discretionary purchases of vehicles or aftermarket products, and demand for off-highway equipment;
(xiv) the cyclical nature of the global vehicular industry, including the performance of the global aftermarket sector and longer product lives of automobile parts;
(xv) product warranty costs;
(xvi) the failure or breach of our information technology systems and the consequences that such failure or breach may have to our business;
(xvii) the company's ability to develop and profitably commercialize new products and technologies, and the acceptance of such new products and technologies by the company's customers and the market;
(xviii) changes by the Financial Accounting Standards Board or other accounting regulatory bodies to authoritative generally accepted accounting principles or policies;
(xix) changes in accounting estimates and assumptions, including changes based on additional information;
(xx) the impact of the extensive, increasing and changing laws and regulations to which we are subject, including environmental laws and regulations, which may result in our incurrence of environmental liabilities in excess of the amount reserved;
(xxi) natural disasters, acts of war and/or terrorism and the impact of these occurrences or acts on economic, financial, industrial and social condition, including, without limitation, with respect to supply chains and customer demand in the countries where the company operates; and
(xxii) the timing and occurrence (or non-occurrence) of transactions and events which may be subject to circumstances beyond the control of the company and its subsidiaries.
The company undertakes no obligation to update any forward-looking statement to reflect events or circumstances after the date of this press release. Additional information regarding these risk factors and uncertainties is detailed from time to time in the company's SEC filings, including but not limited to its annual report on Form 10-K for the year ended December 31, 2015.
| ATTACHMENT 1 | ||||||||||
| TENNECO INC. AND CONSOLIDATED SUBSIDIARIES | ||||||||||
| STATEMENTS OF INCOME | ||||||||||
Unaudited | ||||||||||
| THREE MONTHS ENDED MARCH 31, | ||||||||||
| (Millions except per share amounts) | ||||||||||
| 2016 | 2015 | |||||||||
| Net sales and operating revenues | ||||||||||
| Clean Air Division - Value-add revenues | $ | 1,005 | $ | 941 | ||||||
| Clean Air Division - Substrate sales | 510 | 464 | ||||||||
| Ride Performance Division - Value-add revenues | 621 | 618 | ||||||||
| $ | 2,136 | $ | 2,023 | |||||||
| Costs and expenses | ||||||||||
| Cost of sales (exclusive of depreciation and amortization shown below) | 1,770 | (a) | 1,686 | (c) | ||||||
| Engineering, research and development | 39 | 41 | ||||||||
| Selling, general and administrative | 147 | (a) | 125 | (c) | ||||||
| Depreciation and amortization of other intangibles | 54 | (a) | 50 | |||||||
| Total costs and expenses | 2,010 | 1,902 | ||||||||
| Loss on sale of receivables | (1 | ) | (1 | ) | ||||||
| Other income (expense) | (1 | ) | (a) | - | ||||||
| Total other income (expense) | (2 | ) | (1 | ) | ||||||
| Earnings before interest expense, income taxes, | ||||||||||
| and noncontrolling interests | ||||||||||
| Clean Air Division | 111 | 91 | (c) | |||||||
| Ride Performance Division | 49 | (a) | 53 | (c) | ||||||
| Other | (36 | ) | (24 | ) | ||||||
| 124 | 120 | |||||||||
| Interest expense (net of interest capitalized) | 18 | 16 | ||||||||
| Earnings before income taxes and noncontrolling interests | 106 | 104 | ||||||||
| Income tax expense | 34 | (b) | 41 | (d) | ||||||
| Net income | 72 | 63 | ||||||||
| Less: Net income attributable to noncontrolling interests | 15 | 14 | ||||||||
| Net income attributable to Tenneco Inc. | $ | 57 | $ | 49 | ||||||
| Weighted average common shares outstanding: | ||||||||||
| Basic | 57.1 | 61.0 | ||||||||
| Diluted | 57.4 | 61.6 | ||||||||
| Earnings per share of common stock: | ||||||||||
| Basic | $ | 1.00 | $ | 0.81 | ||||||
| Diluted | $ | 0.99 | $ | 0.80 | ||||||
| (a) Includes restructuring and related charges of $14 million pre-tax, $13 million after tax or $0.23 per diluted share. Of the amount, $3 million is recorded in cost of sales, $6 million is recorded in selling, general and administrative expenses, $3 million is recorded in depreciation and amortization and $2 million is recorded in other income (expense). |
| (b) Includes net tax benefits of $3 million or $0.05 per diluted share for tax adjustments to prior year estimates. |
| (c) Includes restructuring and related charges of $5 million pre-tax, $4 million after tax or $0.07 per diluted share. Of the amount, $4 million is recorded in cost of sales and $1 million is recorded in selling, general and administrative expenses. $2 million is recorded in the Clean Air Division and $3 million is recorded in the Ride Performance Division. |
| (d) Includes net adjustments of $1 million or $0.01 per diluted share for tax adjustments to prior year estimates. |
| ATTACHMENT 1 | ||||||||
| TENNECO INC. AND CONSOLIDATED SUBSIDIARIES | ||||||||
| BALANCE SHEETS | ||||||||
| (Unaudited) | ||||||||
| (Millions) | ||||||||
| March 31, 2016 | December 31, 2015 | |||||||
| Assets | ||||||||
| Cash and cash equivalents | $ | 374 | $ | 287 | ||||
| Restricted cash | 2 | 1 | ||||||
| Receivables, net | 1,286 | (a) | 1,112 | (a) | ||||
| Inventories | 746 | 682 | ||||||
| Other current assets | 254 | 229 | ||||||
| Investments and other assets | 408 | 413 | ||||||
| Plant, property, and equipment, net | 1,278 | 1,243 | ||||||
| Total assets | $ | 4,348 | $ | 3,967 | ||||
| Liabilities and Shareholders' Equity | ||||||||
| Short-term debt | $ | 97 | $ | 86 | ||||
| Accounts payable | 1,462 | 1,376 | ||||||
| Accrued taxes | 52 | 37 | ||||||
| Accrued interest | 16 | 4 | ||||||
| Other current liabilities | 294 | 291 | ||||||
| Long-term debt | 1,311 | (b) | 1,124 | (b) | ||||
| Deferred income taxes | 9 | 7 | ||||||
| Deferred credits and other liabilities | 502 | 524 | ||||||
| Redeemable noncontrolling interests | 51 | 43 | ||||||
| Tenneco Inc. shareholders' equity | 505 | 433 | ||||||
| Noncontrolling interests | 49 | 42 | ||||||
Total liabilities, redeemable noncontrolling interests and shareholders' equity | $ | 4,348 | $ | 3,967 | ||||
| March 31, 2016 | December 31, 2015 | |||||||
(a) Accounts Receivables net of: | ||||||||
| Europe - Accounts receivables securitization programs | $ | 208 | $ | 174 | ||||
| March 31, 2016 | December 31, 2015 | |||||||
(b) Long term debt composed of: | ||||||||
| Borrowings against revolving credit facilities | $ | 288 | $ | 105 | ||||
| Term loan A (Due 2019) | 281 | 285 | ||||||
| 6.875% senior notes (Due 2020) | 500 | 500 | ||||||
| 5.375% senior notes (Due 2024) | 225 | 225 | ||||||
| Other long term debt | 17 | 9 | ||||||
| $ | 1,311 | $ | 1,124 | |||||
ATTACHMENT 1 | ||||||||
| Tenneco Inc. and Consolidated Subsidiaries | ||||||||
| Statements of Cash Flows | ||||||||
| (Unaudited) | ||||||||
| (Millions) | ||||||||
| Three Months Ended | ||||||||
| March 31, | ||||||||
| 2016 | 2015 | |||||||
| Operating activities: | ||||||||
| Net income | $ | 72 | $ | 63 | ||||
| Adjustments to reconcile net income | ||||||||
| to net cash used by operating activities - | ||||||||
| Depreciation and amortization of other intangibles | 54 | 50 | ||||||
| Stock-based compensation | 7 | 6 | ||||||
| Deferred income taxes | 3 | (6 | ) | |||||
| Changes in components of working capital- | ||||||||
| (Inc.)/dec. in receivables | (160 | ) | (194 | ) | ||||
| (Inc.)/dec. in inventories | (51 | ) | (59 | ) | ||||
| (Inc.)/dec. in prepayments and other current assets | (19 | ) | (7 | ) | ||||
| Inc./(dec.) in payables | 56 | 77 | ||||||
| Inc./(dec.) in accrued taxes | 15 | 12 | ||||||
| Inc./(dec.) in accrued interest | 12 | 13 | ||||||
| Inc./(dec.) in other current liabilities | (17 | ) | (2 | ) | ||||
| Changes in long-term assets | 3 | 2 | ||||||
| Changes in long-term liabilities | (5 | ) | (3 | ) | ||||
| Other | 1 | (2 | ) | |||||
| Net cash used by operating activities | (29 | ) | (50 | ) | ||||
| Investing activities: | ||||||||
| Proceeds from sale of assets | 1 | 1 | ||||||
| Cash payments for plant, property & equipment | (68 | ) | (77 | ) | ||||
| Cash payments for software-related intangible assets | (6 | ) | (5 | ) | ||||
| Change in restricted cash | (1 | ) | 3 | |||||
| Net cash used by investing activities | (74 | ) | (78 | ) | ||||
| Financing activities: | ||||||||
| Issuance (Repurchase) of common shares | (2 | ) | - | |||||
| Purchase of common stock under the share repurchase program | (16 | ) | (11 | ) | ||||
| Tax impact from stock-based compensation | - | 3 | ||||||
| Issuance of long-term debt | 5 | - | ||||||
| Retirement of long-term debt | (4 | ) | (4 | ) | ||||
| Net inc./(dec.) in bank overdrafts | 7 | (8 | ) | |||||
| Net inc./(dec.) in revolver borrowings and short-term debt excluding current maturities on | ||||||||
| long-term debt and short-term borrowings secured by accounts receivable | 193 | 111 | ||||||
| Net inc./(dec.) in short-term debt secured by accounts receivable | - | 50 | ||||||
| Net cash provided by financing activities | 183 | 141 | ||||||
| Effect of foreign exchange rate changes on cash and | ||||||||
| cash equivalents | 7 | (7 | ) | |||||
| Increase in cash and cash equivalents | 87 | 6 | ||||||
| Cash and cash equivalents, January 1 | 287 | 282 | ||||||
| Cash and cash equivalents, March 31 | $ | 374 | $ | 288 | ||||
| Supplemental Cash Flow Information | ||||||||
| Cash paid during the period for interest (net of interest capitalized) | $ | 6 | $ | 4 | ||||
| Cash paid during the period for income taxes (net of refunds) | 21 | - | ||||||
| Non-cash Investing and Financing Activities | ||||||||
| Period ended balance of payables for plant, property, and equipment | $ | 41 | $ | 34 | ||||
ATTACHMENT 2 | ||||||||||||||||||||||||||||||||
| TENNECO INC. | ||||||||||||||||||||||||||||||||
| RECONCILIATION OF GAAP(1) NET INCOME TO EBITDA INCLUDING NONCONTROLLING INTERESTS (2) | ||||||||||||||||||||||||||||||||
Unaudited | ||||||||||||||||||||||||||||||||
| (Millions) | ||||||||||||||||||||||||||||||||
| Q1 2016 | ||||||||||||||||||||||||||||||||
| Clean Air Division | Ride Performance Division | |||||||||||||||||||||||||||||||
North |
Europe, |
Asia | Total |
North |
Europe, |
Asia | Total | Other | Total | |||||||||||||||||||||||
| Net income attributable to Tenneco Inc. | $ | 57 | ||||||||||||||||||||||||||||||
| Net income attributable to noncontrolling interests | 15 | |||||||||||||||||||||||||||||||
| Net income | 72 | |||||||||||||||||||||||||||||||
| Income tax expense | 34 | |||||||||||||||||||||||||||||||
| Interest expense (net of interest capitalized) | 18 | |||||||||||||||||||||||||||||||
| EBIT, Earnings before interest expense, income taxes and noncontrolling interests (GAAP measure) | $ | 62 | $ | 16 | $ | 33 | $ | 111 | $ | 42 | $ | (4 | ) | $ | 11 | $ | 49 | $ | (36 | ) | 124 | |||||||||||
| Depreciation and amortization of other intangibles | 15 | 10 | 7 | 32 | 9 | 11 | 2 | 22 | - | 54 | ||||||||||||||||||||||
| Total EBITDA including noncontrolling interests (2) | $ | 77 | $ | 26 | $ | 40 | $ | 143 | $ | 51 | $ | 7 | $ | 13 | $ | 71 | $ | (36 | ) | $ | 178 | |||||||||||
| Q1 2015 | ||||||||||||||||||||||||||||||||
| Clean Air Division | Ride Performance Division | |||||||||||||||||||||||||||||||
North |
Europe, |
Asia | Total |
North |
Europe, |
Asia | Total | Other | Total | |||||||||||||||||||||||
| Net income attributable to Tenneco Inc. | $ | 49 | ||||||||||||||||||||||||||||||
| Net income attributable to noncontrolling interests | 14 | |||||||||||||||||||||||||||||||
| Net income | 63 | |||||||||||||||||||||||||||||||
| Income tax expense | 41 | |||||||||||||||||||||||||||||||
| Interest expense (net of interest capitalized) | 16 | |||||||||||||||||||||||||||||||
| EBIT, Earnings before interest expense, income taxes and noncontrolling interests (GAAP measure) | $ | 54 | $ | 10 | $ | 27 | $ | 91 | $ | 35 | $ | 8 | $ | 10 | $ | 53 | $ | (24 | ) | 120 | ||||||||||||
| Depreciation and amortization of other intangibles | 17 | 10 | 6 | 33 | 8 | 8 | 1 | 17 | - | 50 | ||||||||||||||||||||||
| Total EBITDA including noncontrolling interests (2) | $ | 71 | $ | 20 | $ | 33 | $ | 124 | $ | 43 | $ | 16 | $ | 11 | $ | 70 | $ | (24 | ) | $ | 170 | |||||||||||
| (1) Generally Accepted Accounting Principles |
| (2) EBITDA including noncontrolling interests represents income before interest expense, income taxes, noncontrolling interests and depreciation and amortization. EBITDA including noncontrolling interests is not a calculation based upon generally accepted accounting principles. The amounts included in the EBITDA including noncontrolling interests calculation, however, are derived from amounts included in the historical statements of income data. In addition, EBITDA including noncontrolling interests should not be considered as an alternative to net income (loss) attributable to Tenneco Inc. or operating income as an indicator of the company's operating performance, or as an alternative to operating cash flows as a measure of liquidity. Tenneco has presented EBITDA including noncontrolling interests because it regularly reviews EBITDA including noncontrolling interests as a measure of the company's performance. In addition, Tenneco believes its investors utilize and analyze the company's EBITDA including noncontrolling interests for similar purposes. Tenneco also believes EBITDA including noncontrolling interests assists investors in comparing a company's performance on a consistent basis without regard to depreciation and amortization, which can vary significantly depending upon many factors. However, the EBITDA including noncontrolling interests measure presented may not always be comparable to similarly titled measures reported by other companies due to differences in the components of the calculation. |
ATTACHMENT 2 | ||||||||||||||||||||||||||||||||||
| TENNECO INC. | ||||||||||||||||||||||||||||||||||
| RECONCILIATION OF GAAP(1) TO NON-GAAP EARNINGS MEASURES(2) | ||||||||||||||||||||||||||||||||||
Unaudited | ||||||||||||||||||||||||||||||||||
| (Millions except per share amounts) | ||||||||||||||||||||||||||||||||||
| Q1 2016 | Q1 2015 | |||||||||||||||||||||||||||||||||
| EBITDA (3) | EBIT | Net income attributable to Tenneco Inc. | Per Share | EBITDA (3) | EBIT | Net income attributable to Tenneco Inc. | Per Share | |||||||||||||||||||||||||||
| Earnings Measures | $ | 178 | $ | 124 | $ | 57 | $ | 0.99 | $ | 170 | $ | 120 | $ | 49 | $ | 0.80 | ||||||||||||||||||
| Adjustments (reflect non-GAAP measures): | ||||||||||||||||||||||||||||||||||
| Restructuring and related expenses | 11 | 14 | 13 | 0.23 | 5 | 5 | 4 | 0.07 | ||||||||||||||||||||||||||
| Net tax adjustments | - | - | (3 | ) | (0.05 | ) | - | - | 1 | 0.01 | ||||||||||||||||||||||||
| Non-GAAP earnings measures | $ | 189 | $ | 138 | $ | 67 | $ | 1.17 | $ | 175 | $ | 125 | $ | 54 | $ | 0.88 | ||||||||||||||||||
| Q1 2016 | ||||||||||||||||||||||||||||||||||
| Clean Air Division | Ride Performance Division | |||||||||||||||||||||||||||||||||
|
North America |
Europe, SA & India |
Asia Pacific | Total |
North America |
Europe, SA & India |
Asia Pacific | Total | Other | Total | |||||||||||||||||||||||||
| EBIT | $ | 62 | $ | 16 | $ | 33 | $ | 111 | $ | 42 | $ | (4 | ) | $ | 11 | $ | 49 | $ | (36 | ) | $ | 124 | ||||||||||||
| Restructuring and related expenses | - | - | - | - | - | 14 | - | 14 | - | 14 | ||||||||||||||||||||||||
| Adjusted EBIT | $ | 62 | $ | 16 | $ | 33 | $ | 111 | $ | 42 | $ | 10 | $ | 11 | $ | 63 | $ | (36 | ) | $ | 138 | |||||||||||||
| Q1 2015 | ||||||||||||||||||||||||||||||||||
| Clean Air Division | Ride Performance Division | |||||||||||||||||||||||||||||||||
North |
Europe, SA & India |
Asia Pacific | Total |
North America |
Europe, SA & India |
Asia Pacific | Total | Other | Total | |||||||||||||||||||||||||
| EBIT | $ | 54 | $ | 10 | $ | 27 | $ | 91 | $ | 35 | $ | 8 | $ | 10 | $ | 53 | $ | (24 | ) | $ | 120 | |||||||||||||
| Restructuring and related expenses | - | 1 | 1 | 2 | - | 3 | - | 3 | - | 5 | ||||||||||||||||||||||||
| Adjusted EBIT | $ | 54 | $ | 11 | $ | 28 | $ | 93 | $ | 35 | $ | 11 | $ | 10 | $ | 56 | $ | (24 | ) | $ | 125 | |||||||||||||
| (1) Generally Accepted Accounting Principles |
| (2) Tenneco presents the above reconciliation of GAAP to non-GAAP earnings measures primarily to reflect the results in a manner that allows a better understanding of the results of operational activities separate from the financial impact of decisions made for the long-term benefit of the company and other items impacting comparability between the periods. Adjustments similar to the ones reflected above have been recorded in earlier periods, and similar types of adjustments can reasonably be expected to be recorded in future periods. Using only the non-GAAP earnings measures to analyze earnings would have material limitations because its calculation is based on the subjective determinations of management regarding the nature and classification of events and circumstances that investors may find material. Management compensates for these limitations by utilizing both GAAP and non-GAAP earnings measures reflected above to understand and analyze the results of the business. The company believes investors find the non-GAAP information helpful in understanding the ongoing performance of operations separate from items that may have a disproportionate positive or negative impact on the company's financial results in any particular period. |
| (3) EBITDA including noncontrolling interests represents income before interest expense, income taxes, noncontrolling interests and depreciation and amortization. EBITDA including noncontrolling interests is not a calculation based upon generally accepted accounting principles. The amounts included in the EBITDA including noncontrolling interests calculation, however, are derived from amounts included in the historical statements of income data. In addition, EBITDA including noncontrolling interests should not be considered as an alternative to net income (loss) attributable to Tenneco Inc. or operating income as an indicator of the company's operating performance, or as an alternative to operating cash flows as a measure of liquidity. Tenneco has presented EBITDA including noncontrolling interests because it regularly reviews EBITDA including noncontrolling interests as a measure of the company's performance. In addition, Tenneco believes its investors utilize and analyze the company's EBITDA including noncontrolling interests for similar purposes. Tenneco also believes EBITDA including noncontrolling interests assists investors in comparing a company's performance on a consistent basis without regard to depreciation and amortization, which can vary significantly depending upon many factors. However, the EBITDA including noncontrolling interests measure presented may not always be comparable to similarly titled measures reported by other companies due to differences in the components of the calculation. |
ATTACHMENT 2 | ||||||||||||||||
| TENNECO INC. | ||||||||||||||||
| RECONCILIATION OF GAAP (1) REVENUE TO NON-GAAP REVENUE MEASURES (2) | ||||||||||||||||
Unaudited | ||||||||||||||||
| (Millions) | ||||||||||||||||
| Q1 2016 | ||||||||||||||||
| Revenues |
Substrate Sales |
Value-add Revenues |
Currency Impact on Value-add Revenues |
Value-add Revenues excluding Currency | ||||||||||||
| Clean Air Division | ||||||||||||||||
| North America | $ | 765 | $ | 271 | $ | 494 | $ | - | $ | 494 | ||||||
| Europe, South America & India | 483 | 177 | 306 | (20 | ) | 326 | ||||||||||
| Asia Pacific | 267 | 62 | 205 | (9 | ) | 214 | ||||||||||
| Total Clean Air Division | 1,515 | 510 | 1,005 | (29 | ) | 1,034 | ||||||||||
| Ride Performance Division | ||||||||||||||||
| North America | 323 | - | 323 | (4 | ) | 327 | ||||||||||
| Europe, South America & India | 237 | - | 237 | (24 | ) | 261 | ||||||||||
| Asia Pacific | 61 | - | 61 | (4 | ) | 65 | ||||||||||
| Total Ride Performance Division | 621 | - | 621 | (32 | ) | 653 | ||||||||||
| Total Tenneco Inc. | $ | 2,136 | $ | 510 | $ | 1,626 | $ | (61 | ) | $ | 1,687 | |||||
| Q1 2015 | ||||||||||||||||
| Revenues |
Substrate Sales |
Value-add Revenues |
Currency Impact on Value-add Revenues |
Value-add Revenues excluding Currency | ||||||||||||
| Clean Air Division | ||||||||||||||||
| North America | $ | 684 | $ | 240 | $ | 444 | $ | - | $ | 444 | ||||||
| Europe, South America & India | 457 | 164 | 293 | - | 293 | |||||||||||
| Asia Pacific | 264 | 60 | 204 | - | 204 | |||||||||||
| Total Clean Air Division | 1,405 | 464 | 941 | - | 941 | |||||||||||
| Ride Performance Division | ||||||||||||||||
| North America | 331 | - | 331 | - | 331 | |||||||||||
| Europe, South America & India | 230 | - | 230 | - | 230 | |||||||||||
| Asia Pacific | 57 | - | 57 | - | 57 | |||||||||||
| Total Ride Performance Division | 618 | - | 618 | - | 618 | |||||||||||
| Total Tenneco Inc. | $ | 2,023 | $ | 464 | $ | 1,559 | $ | - | $ | 1,559 | ||||||
(1) Generally Accepted Accounting Principles |
(2) Tenneco presents the above reconciliation of revenues in order to reflect value-add revenues separately from the effects of doing business in currencies other than the U.S. dollar. Additionally, substrate sales include precious metals pricing, which may be volatile. Substrate sales occur when, at the direction of its OE customers, Tenneco purchases catalytic converters or components thereof from suppliers, uses them in its manufacturing processes and sells them as part of the completed system. While Tenneco original equipment customers assume the risk of this volatility, it impacts reported revenue. Excluding substrate sales removes this impact. Tenneco uses this information to analyze the trend in revenues before these factors. Tenneco believes investors find this information useful in understanding period to period comparisons in the company's revenues. |
ATTACHMENT 2 | ||||||||||||||
| TENNECO INC. | ||||||||||||||
| RECONCILIATION OF GAAP REVENUE TO NON-GAAP REVENUE MEASURES | ||||||||||||||
Unaudited | ||||||||||||||
| (Millions except percents) | ||||||||||||||
| Q1 2016 vs. Q1 2015 $ Change and % Change Increase (Decrease) | ||||||||||||||
| Revenues | % Change | Value-add Revenues Excluding Currency | % Change | |||||||||||
| Clean Air Division | ||||||||||||||
| North America | $ | 81 | 12 | % | $ | 50 | 11 | % | ||||||
| Europe, South America & India | 26 | 6 | % | 33 | 11 | % | ||||||||
| Asia Pacific | 3 | 1 | % | 10 | 5 | % | ||||||||
| Total Clean Air Division | 110 | 8 | % | 93 | 10 | % | ||||||||
| Ride Performance Division | ||||||||||||||
| North America | (8 | ) | (2 | %) | (4 | ) | (1 | %) | ||||||
| Europe, South America & India | 7 | 3 | % | 31 | 13 | % | ||||||||
| Asia Pacific | 4 | 7 | % | 8 | 14 | % | ||||||||
| Total Ride Performance Division | 3 | 0 | % | 35 | 6 | % | ||||||||
| Total Tenneco Inc. | $ | 113 | 6 | % | $ | 128 | 8 | % | ||||||
ATTACHMENT 2 | |||||||||||||||
| TENNECO INC. | |||||||||||||||
| RECONCILIATION OF NON-GAAP MEASURES | |||||||||||||||
| Debt net of cash / Adjusted LTM EBITDA including noncontrolling interests | |||||||||||||||
Unaudited | |||||||||||||||
| (Millions except ratios) | |||||||||||||||
Quarter Ended March 31, | |||||||||||||||
| 2016 | 2015 | ||||||||||||||
| Total debt | $ | 1,408 | $ | 1,272 | |||||||||||
| Total cash | 376 | 288 | |||||||||||||
| Debt net of cash balances (1) | $ | 1,032 | $ | 984 | |||||||||||
| Adjusted LTM EBITDA including noncontrolling interests (2) (3) | $ | 799 | $ | 785 | |||||||||||
| Ratio of debt net of cash balances to adjusted LTM EBITDA including noncontrolling interests (4) | 1.3x | 1.3x | |||||||||||||
| Q2 15 | Q3 15 | Q4 15 | Q1 16 | Q1 16 LTM | |||||||||||
| Net income attributable to Tenneco Inc. | $ | 78 | $ | 52 | $ | 68 | $ | 57 | $ | 255 | |||||
| Net income attributable to noncontrolling interests | 13 | 14 | 15 | 15 | 57 | ||||||||||
| Income tax expense | 47 | 34 | 27 | 34 | 142 | ||||||||||
| Interest expense (net of interest capitalized) | 17 | 16 | 18 | 18 | 69 | ||||||||||
| EBIT, Earnings before interest expense, income taxes and noncontrolling interests (GAAP measure) | 155 | 116 | 128 | 124 | 523 | ||||||||||
| Depreciation and amortization of other intangibles | 51 | 53 | 49 | 54 | 207 | ||||||||||
| Total EBITDA including noncontrolling interests (2) | 206 | 169 | 177 | 178 | 730 | ||||||||||
| Restructuring and related expenses | 7 | 31 | 16 | 11 | 65 | ||||||||||
| Pension charges (6) | - | - | 4 | - | 4 | ||||||||||
| Total Adjusted EBITDA including noncontrolling interest (3) | $ | 213 | $ | 200 | $ | 197 | $ | 189 | $ | 799 | |||||
| Q2 14 | Q3 14 | Q4 14 | Q1 15 | Q1 15 LTM | |||||||||||
| Net income attributable to Tenneco Inc. | $ | 81 | $ | 78 | $ | 21 | $ | 49 | $ | 229 | |||||
| Net income attributable to noncontrolling interests | 10 | 11 | 15 | 14 | 50 | ||||||||||
| Income tax expense | 46 | 31 | 14 | 41 | 132 | ||||||||||
| Interest expense (net of interest capitalized) | 19 | 20 | 33 | 16 | 88 | ||||||||||
| EBIT, Earnings before interest expense, income taxes and noncontrolling interests (GAAP measure) | 156 | 140 | 83 | 120 | 499 | ||||||||||
| Depreciation and amortization of other intangibles | 52 | 52 | 53 | 50 | 207 | ||||||||||
| Total EBITDA including noncontrolling interests (2) | 208 | 192 | 136 | 170 | 706 | ||||||||||
| Restructuring and related expenses | 10 | 8 | 20 | 5 | 43 | ||||||||||
| Bad debt charge (5) | - | 4 | - | - | 4 | ||||||||||
| Pension/Postretirement charges (6) | - | - | 32 | - | 32 | ||||||||||
| Total Adjusted EBITDA including noncontrolling interest (3) | $ | 218 | $ | 204 | $ | 188 | $ | 175 | $ | 785 | |||||
| (1) Tenneco presents debt net of cash balances because management believes it is a useful measure of Tenneco's credit position and progress toward reducing leverage. The calculation is limited in that the company may not always be able to use cash to repay debt on a dollar-for-dollar basis. | |
| (2) EBITDA including noncontrolling interests represents income before interest expense, income taxes, noncontrolling interests and depreciation and amortization. EBITDA including noncontrolling interests is not a calculation based upon generally accepted accounting principles. The amounts included in the EBITDA including noncontrolling interests calculation, however, are derived from amounts included in the historical statements of income data. In addition, EBITDA including noncontrolling interests should not be considered as an alternative to net income (loss) attributable to Tenneco Inc. or operating income as an indicator of the company's operating performance, or as an alternative to operating cash flows as a measure of liquidity. Tenneco has presented EBITDA including noncontrolling interests because it regularly reviews EBITDA including noncontrolling interests as a measure of the company's performance. In addition, Tenneco believes its investors utilize and analyze the company's EBITDA including noncontrolling interests for similar purposes. Tenneco also believes EBITDA including noncontrolling interests assists investors in comparing a company's performance on a consistent basis without regard to depreciation and amortization, which can vary significantly depending upon many factors. However, the EBITDA including noncontrolling interests measure presented may not always be comparable to similarly titled measures reported by other companies due to differences in the components of the calculation. | |
| (3) Adjusted EBITDA including noncontrolling interests is presented in order to reflect the results in a manner that allows a better understanding of operational activities separate from the financial impact of decisions made for the long term benefit of the company and other items impacting comparability between the periods. Similar adjustments to EBITDA including noncontrolling interests have been recorded in earlier periods, and similar types of adjustments can reasonably be expected to be recorded in future periods. The company believes investors find the non-GAAP information helpful in understanding the ongoing performance of operations separate from items that may have a disproportionate positive or negative impact on the company's financial results in any particular period. | |
| (4) Tenneco presents the above reconciliation of the ratio of debt net of cash to LTM adjusted EBITDA including noncontrolling interests to show trends that investors may find useful in understanding the company's ability to service its debt. For purposes of this calculation, LTM adjusted EBITDA including noncontrolling interests is used as an indicator of the company's performance and debt net of cash is presented as an indicator of the company's credit position and progress toward reducing the company's financial leverage. This reconciliation is provided as supplemental information and not intended to replace the company's existing covenant ratios or any other financial measures that investors may find useful in describing the company's financial position. See notes (1), (2) and (3) for a description of the limitations of using debt net of cash, EBITDA including noncontrolling interests and adjusted EBITDA including noncontrolling interests. | |
| (5) Charge related to the bankruptcy of an aftermarket customer in Europe. | |
| (6) Charges related to Pension derisking and postretirement medical true-up. | |
ATTACHMENT 2 | ||||||||||||||||
| TENNECO INC. | ||||||||||||||||
| RECONCILIATION OF GAAP (1) REVENUE TO NON-GAAP REVENUE MEASURES (2) | ||||||||||||||||
Unaudited | ||||||||||||||||
| (Millions) | ||||||||||||||||
| Q1 2016 | ||||||||||||||||
Revenues | Currency | Revenues Excluding Currency | Substrate Sales Excluding Currency | Value-add Revenues Excluding Currency | ||||||||||||
| Original equipment light vehicle revenues | $ | 1,577 | $ | (46 | ) | $ | 1,623 | $ | 448 | $ | 1,175 | |||||
| Original equipment commercial truck, off-highway and other revenues | 252 | (7 | ) | 259 | 70 | 189 | ||||||||||
| Aftermarket revenues | 307 | (16 | ) | 323 | - | 323 | ||||||||||
| Net sales and operating revenues | $ | 2,136 | $ | (69 | ) | $ | 2,205 | $ | 518 | $ | 1,687 | |||||
| Q1 2015 | ||||||||||||||||
Revenues | Currency | Revenues Excluding Currency | Substrate Sales Excluding Currency | Value-add Revenues Excluding Currency | ||||||||||||
| Original equipment light vehicle revenues | $ | 1,466 | $ | - | $ | 1,466 | $ | 392 | $ | 1,074 | ||||||
| Original equipment commercial truck, off-highway and other revenues | 257 | - | 257 | 72 | 185 | |||||||||||
| Aftermarket revenues | 300 | - | 300 | - | 300 | |||||||||||
| Net sales and operating revenues | $ | 2,023 | $ | - | $ | 2,023 | $ | 464 | $ | 1,559 | ||||||
| (1) Generally Accepted Accounting Principles |
| (2) Tenneco presents the above reconciliation of revenues in order to reflect value-add revenues separately from the effects of doing business in currencies other than the U.S. dollar. Additionally, substrate sales include precious metals pricing, which may be volatile. Substrate sales occur when, at the direction of its OE customers, Tenneco purchases catalytic converters or components thereof from suppliers, uses them in its manufacturing processes and sells them as part of the completed system. While Tenneco original equipment customers assume the risk of this volatility, it impacts reported revenue. Excluding substrate sales removes this impact. Tenneco uses this information to analyze the trend in revenues before these factors. Tenneco believes investors find this information useful in understanding period to period comparisons in the company's revenues. |
ATTACHMENT 2 | |||||||||||||||||||||||||||||||||||||||||
| TENNECO INC. | |||||||||||||||||||||||||||||||||||||||||
| RECONCILIATION OF GAAP (1) REVENUE AND EARNINGS TO NON-GAAP REVENUE AND EARNINGS MEASURES (2) | |||||||||||||||||||||||||||||||||||||||||
Unaudited | |||||||||||||||||||||||||||||||||||||||||
| (Millions except percents) | |||||||||||||||||||||||||||||||||||||||||
| Q1 2016 | |||||||||||||||||||||||||||||||||||||||||
| Clean Air Division | Ride Performance Division | ||||||||||||||||||||||||||||||||||||||||
|
North America |
Europe, SA & India |
Asia Pacific | Total |
North America |
Europe, SA & India |
Asia Pacific | Total | Other | Total | ||||||||||||||||||||||||||||||||
| Net sales and operating revenues | $ | 765 | $ | 483 | $ | 267 | $ | 1,515 | $ | 323 | $ | 237 | $ | 61 | $ | 621 | $ | - | $ | 2,136 | |||||||||||||||||||||
| Less: Substrate sales | 271 | 177 | 62 | 510 | - | - | - | - | - | 510 | |||||||||||||||||||||||||||||||
| Value-add revenues | $ | 494 | $ | 306 | $ | 205 | $ | 1,005 | $ | 323 | $ | 237 | $ | 61 | $ | 621 | $ | - | $ | 1,626 | |||||||||||||||||||||
| EBIT | $ | 62 | $ | 16 | $ | 33 | $ | 111 | $ | 42 | $ | (4 | ) | $ | 11 | $ | 49 | $ | (36 | ) | $ | 124 | |||||||||||||||||||
| EBIT as a % of revenue | 8.1 | % | 3.3 | % | 12.4 | % | 7.3 | % | 13.0 | % | -1.7 | % | 18.0 | % | 7.9 | % | 5.8 | % | |||||||||||||||||||||||
| EBIT as a % of value-add revenue | 12.6 | % | 5.2 | % | 16.1 | % | 11.0 | % | 13.0 | % | -1.7 | % | 18.0 | % | 7.9 | % | 7.6 | % | |||||||||||||||||||||||
| Adjusted EBIT | $ | 62 | $ | 16 | $ | 33 | $ | 111 | $ | 42 | $ | 10 | $ | 11 | $ | 63 | $ | (36 | ) | $ | 138 | ||||||||||||||||||||
| Adjusted EBIT as a % of revenue | 8.1 | % | 3.3 | % | 12.4 | % | 7.3 | % | 13.0 | % | 4.2 | % | 18.0 | % | 10.1 | % | 6.5 | % | |||||||||||||||||||||||
| Adjusted EBIT as a % of value-add revenue | 12.6 | % | 5.2 | % | 16.1 | % | 11.0 | % | 13.0 | % | 4.2 | % | 18.0 | % | 10.1 | % | 8.5 | % | |||||||||||||||||||||||
| Q1 2015 | |||||||||||||||||||||||||||||||||||||||||
| Clean Air Division | Ride Performance Division | ||||||||||||||||||||||||||||||||||||||||
|
North America |
Europe, SA & India |
Asia Pacific | Total |
North America |
Europe, SA & India |
Asia Pacific | Total | Other | Total | ||||||||||||||||||||||||||||||||
| Net sales and operating revenues | $ | 684 | $ | 457 | $ | 264 | $ | 1,405 | $ | 331 | $ | 230 | $ | 57 | $ | 618 | $ | - | $ | 2,023 | |||||||||||||||||||||
| Less: Substrate sales | 240 | 164 | 60 | 464 | - | - | - | - | - | 464 | |||||||||||||||||||||||||||||||
| Value-add revenues | $ | 444 | $ | 293 | $ | 204 | $ | 941 | $ | 331 | $ | 230 | $ | 57 | $ | 618 | $ | - | $ | 1,559 | |||||||||||||||||||||
| EBIT | $ | 54 | $ | 10 | $ | 27 | $ | 91 | $ | 35 | $ | 8 | $ | 10 | $ | 53 | $ | (24 | ) | $ | 120 | ||||||||||||||||||||
| EBIT as a % of revenue | 7.9 | % | 2.2 | % | 10.2 | % | 6.5 | % | 10.6 | % | 3.5 | % | 17.5 | % | 8.6 | % | 5.9 | % | |||||||||||||||||||||||
| EBIT as a % of value-add revenue | 12.2 | % | 3.4 | % | 13.2 | % | 9.7 | % | 10.6 | % | 3.5 | % | 17.5 | % | 8.6 | % | 7.7 | % | |||||||||||||||||||||||
| Adjusted EBIT | $ | 54 | $ | 11 | $ | 28 | $ | 93 | $ | 35 | $ | 11 | $ | 10 | $ | 56 | $ | (24 | ) | $ | 125 | ||||||||||||||||||||
| Adjusted EBIT as a % of revenue | 7.9 | % | 2.4 | % | 10.6 | % | 6.6 | % | 10.6 | % | 4.8 | % | 17.5 | % | 9.1 | % | 6.2 | % | |||||||||||||||||||||||
| Adjusted EBIT as a % of value-add revenue | 12.2 | % | 3.8 | % | 13.7 | % | 9.9 | % | 10.6 | % | 4.8 | % | 17.5 | % | 9.1 | % | 8.0 | % | |||||||||||||||||||||||
(1) Generally Accepted Accounting Principles |
(2) Tenneco presents the above reconciliation of revenues in order to reflect EBIT as a percent of both total revenues and value-add revenues. Substrate sales include precious metals pricing, which may be volatile. Substrate sales occur when, at the direction of its OE customers, Tenneco purchases catalytic converters or components thereof from suppliers, uses them in its manufacturing processes and sells them as part of the completed system. While Tenneco original equipment customers assume the risk of this volatility, it impacts reported revenue. Excluding substrate sales removes this impact. Further, presenting EBIT as a percent of value-add revenue assists investors in evaluating the company's operational performance without the impact of such substrate sales. |
ATTACHMENT 2 | |||||||||
| TENNECO INC. | |||||||||
RECONCILIATION OF GAAP (1) REVENUE TO NON-GAAP REVENUE MEASURES (2) - Original equipment commercial truck, off-highway and other revenues | |||||||||
Unaudited | |||||||||
| (Millions) | |||||||||
| 2016 | |||||||||
| Q1 | |||||||||
| Substrate | Value-add | ||||||||
| Revenues | Sales | Revenues | |||||||
| Clean Air Division | |||||||||
| North America | $ | 92 | $ | 26 | $ | 66 | |||
| Europe, South America & India | 73 | 29 | 44 | ||||||
| Asia Pacific | 35 | 14 | 21 | ||||||
| Total Clean Air Division | 200 | 69 | 131 | ||||||
| Total Ride Performance Division | 52 | - | 52 | ||||||
| Total Tenneco Inc. | $ | 252 | $ | 69 | $ | 183 | |||
| 2015 | |||||||||
| Q1 | |||||||||
| Substrate | Value-add | ||||||||
| Revenues | Sales | Revenues | |||||||
| Clean Air Division | |||||||||
| North America | $ | 86 | $ | 31 | $ | 55 | |||
| Europe, South America & India | 73 | 29 | 44 | ||||||
| Asia Pacific | 31 | 12 | 19 | ||||||
| Total Clean Air Division | 190 | 72 | 118 | ||||||
| Total Ride Performance Division | 67 | - | 67 | ||||||
| Total Tenneco Inc. | $ | 257 | $ | 72 | $ | 185 | |||
| (1) Generally Accepted Accounting Principles | |
| (2) Tenneco presents the above reconciliation of revenues in order to reflect value-add revenues separately from substrate sales which include precious metals pricing, which may be volatile. Substrate sales occur when, at the direction of its OE customers, Tenneco purchases catalytic converters or components thereof from suppliers, uses them in its manufacturing processes and sells them as part of the completed system. While Tenneco original equipment customers assume the risk of this volatility, it impacts reported revenue. Excluding substrate sales removes this impact. Tenneco uses this information to analyze the trend in revenues before these factors. Tenneco believes investors find this information useful in understanding period to period comparisons in the company's revenues. | |
View source version on businesswire.com: http://www.businesswire.com/news/home/20160426005934/en/
Contacts:
Investor inquiries:
Linae Golla
847-482-5162
lgolla@tenneco.com
or
Media
inquiries:
Bill Dawson
847-482-5807
bdawson@tenneco.com
