
Courtesy of Sabrient Systems and Gradient Analytics
 Overall, the economy appears to be on a steady path to recovery. As the Federal Reserve eventually allows interest rates to rise, we likely will see a rotation out of value and into growth as defensive debt-intensive companies struggle relative to companies that have lower debt burden and stronger prospective earnings growth. However, that doesn’t mean that stocks will maintain the same low-volatility “all-boats-lifted-in-a-rising-tide” performance. And don’t forget the timeless “Sell in May and Go Away” adage that is on our doorstep.
The market is quite overdue for one of those scary selloffs — not just the buyable entry-point pullbacks we’ve been seeing for so long — and it just might become a self-fulfilling prophecy. In any case, with Fed tapering, volatility is widely expected to increase. As I discuss below, although the fundamentals-based rankings are more solidly bullish this week, the near-term technical picture has taken quite the bearish look.
Among the ten U.S. business sectors, defensive sector Utilities is up over +12% year to date and no one else is even close. The CBOE Market Volatility Index (VIX), a.k.a. “fear gauge,” closed last week at 14.06 and remains below the 15 threshold, indicating low investor trepidation about their stocks.
SPY chart review:
The SPDR S&P 500 Trust (SPY) closed Friday at 186.29, which is almost exactly where it finished the prior week. After rallying for most of the week, it gave it all back on Friday, and SPY has found temporary support at the convergence of its 20 and 40-day simple moving averages. Now price and oscillators like RSI, MACD, and Slow Stochastic are all rolling over. Although Friday’s weakness could be due simply to profit-taking and risk management ahead of another weekend during this time of instability in Ukraine, it also could be something more serious, as we could be looking at a head-and-shoulders top, as shown.
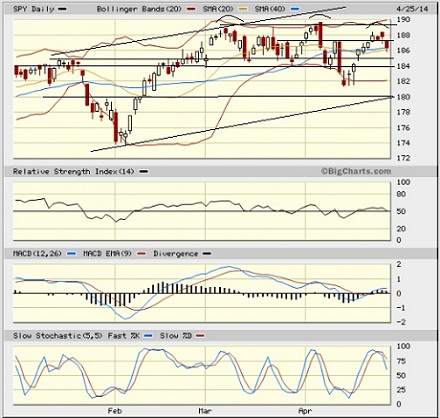
Even more disturbingly, if you look at a weekly (rather than daily) chart, there are bearish “shooting star” candlestick patterns with long upper shadows that support the notion of a broader topping pattern, and in fact last week’s candlestick looks like a dreaded “gravestone doji.” Notably, the NASDAQ, Russell 2000, and Dow Jones Industrials are all still negative year-to-date, while the…
