
 Does this look healthy to you?
We did manage to pull out of a tailspin back in 2011 – the last time our GDP went negative but, funny story – in July of 2011, the S&P fell from 1,350 to 1,100 by August 9th and it gyrated between 1,100 and 1,200 until October when the Fed's "Operation Twist" (because "Operation Screw the Poor" got bad test scores) gave us a boost.
Notice how this post picks up right where yesterday's post left off – I'm clever that way! Yesterday we had the chart that showed us that 10% of our GDP ($1.5Tn) is the result of Fed fiddling and, without it, the GDP would be right back at those 2009 lows. Whether or not you THINK QE will ever end, you sure as hell better have a plan for what you will do in case it does!
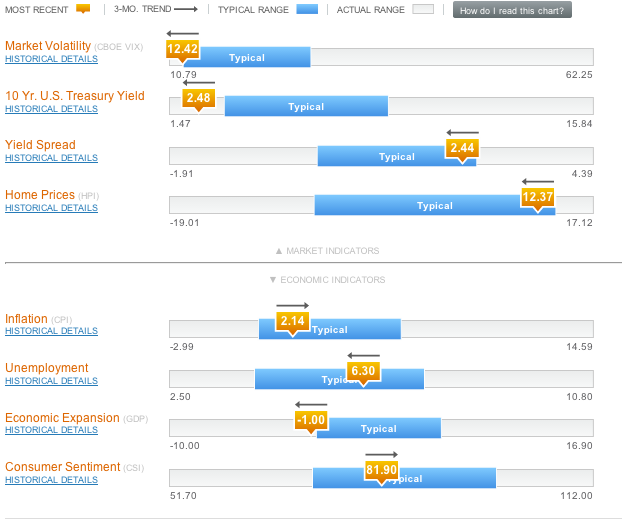 Russell Investments put out their Economic Indicators Dashboard yesterday and it's a nice snapshot of the where the economy is.
The lines over the boxes are the 3-month trends and, thanks to the Fed, 10-year yeilds are just 2.48% and that's keeping home prices high (because you don't buy a home, you buy a mortgage).
Inflation is creeping up and expansion (today's topic) is negative and getting lower. Meanwhile, consumers remain oblivious as the Corporate Media fills them with happy talk. Meanwhile, this BLS chart (via Barry Ritholtz) says it all as manufacturing (good) jobs continue to leave our country at alarming rates:
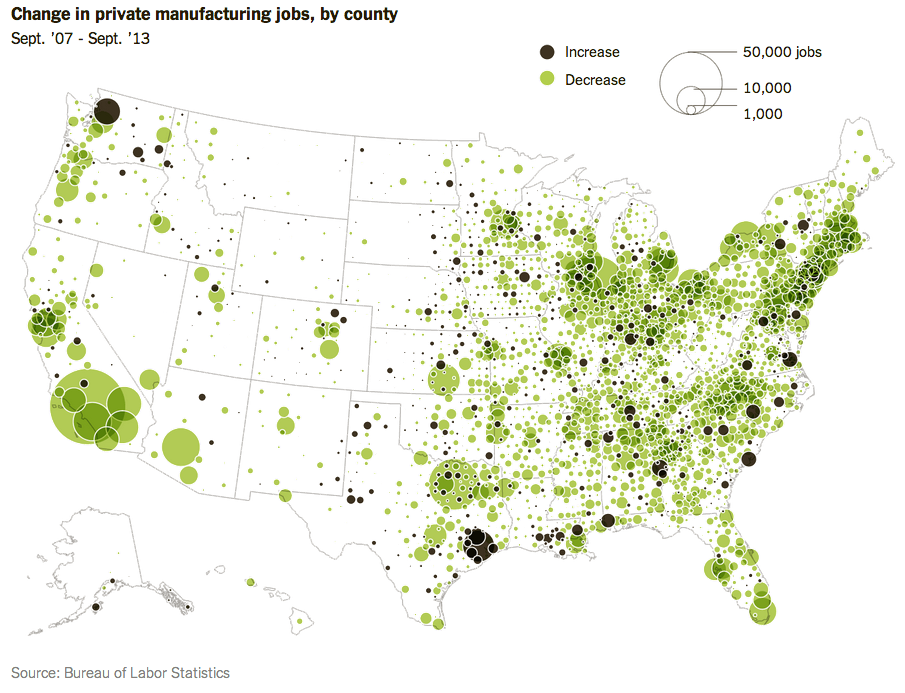
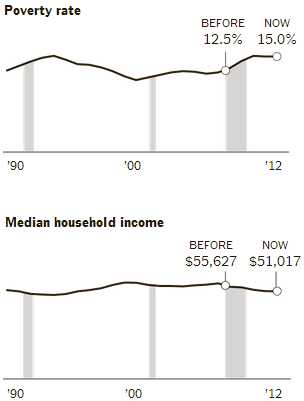 Almost all of the growth spots are from fracking with a little auto production picking up as well. Overall, 1.6M net manufacturing jobs have been lost since 2007 and, much more alarming, the median household income for those lucky enough to still have jobs is down almost 10% over the same period of time.
In other words, if it wasn't for Fed Money, we'd have no money at all! In yesterday's Webinar (replay available here) we talked about how the Fed is like a…
