
It’s never too late to remind all of you that given the huge demand that this product is having, the promotion despite being limited in time, is still available for you with a symbolic cost of just $ 1 for the first month. This is one of the best programs to use on a daily basis and that easily pays for itself. In addition to having an organized aspect quite appealing to quality and speed of news, rumors and alerts, its brutal in that we are almost always the first to know the latest news. In this market the first to be aware of the latest news is always the one that maximizes the profit.
 ( click to enlarge )
You can see a screenshot of the service above. It really is fantastic. I recommend you. Try it today by clicking HERE Just $1 First Month!
and now it's time for charts.
 ( click to enlarge )
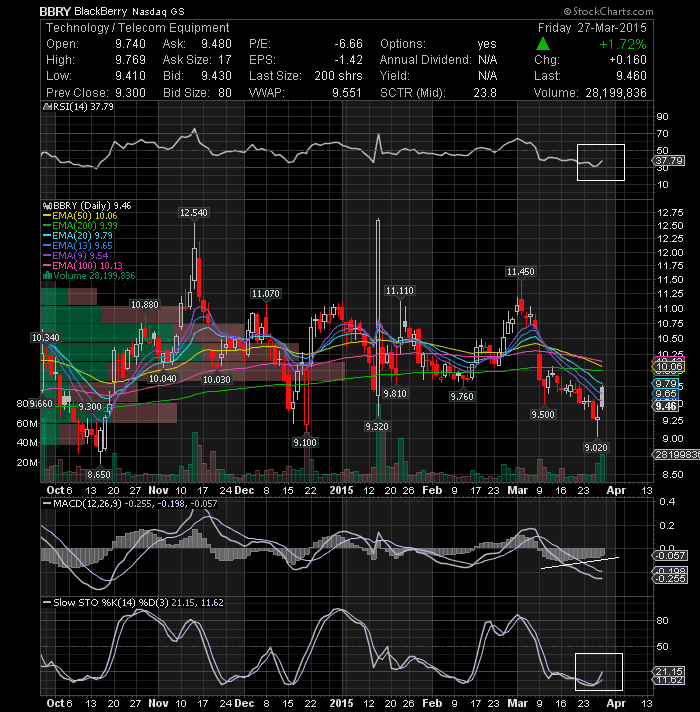
BlackBerry Ltd (NASDAQ:BBRY) posted better-than-expected quarterly earnings yesterday, showing clear signs that its turnaround efforts is giving the first results even with less revenue. They are doing a great job avoiding any cash burn during the business transition. The best part of the report in my opinion was the software revenue that rose 20% from a year earlier, offering signs of the ongoing transition to a more software-driven revenue stream. In addition, the company reported positive cash flow of $76 million in the quarter and its cash position is now $3.27 billion. I continue to believe in Blackberry and in its management, I don’t care about what some analysts are saying due to its conflict of interests. My long term investment requires patience but it will pay off someday. I want to double my money in this one as I have been saying for weeks on twitter. Im very familiar with Blackberry products and all its features, therefore I know in what im currently investing. I could be wrong, I could lose my money but the risk/reward it seems favorable to me. John Chen is doing the same work in controlling operating expenses and eliminating its cash burn like he did at Sybase in the beginning. Im here for the long run. From a technical standpoint, the chart is displaying positive divergences on momentum indicators and with the stock oversold, these are the perfect conditions for a short-term rally IMHO. The RSI has reversed the course and the daily MACD is starting to curl up, suggesting that a positive crossover could be coming soon. I would look for a move up to $10.06 resistance soon.
 ( click to enlarge )
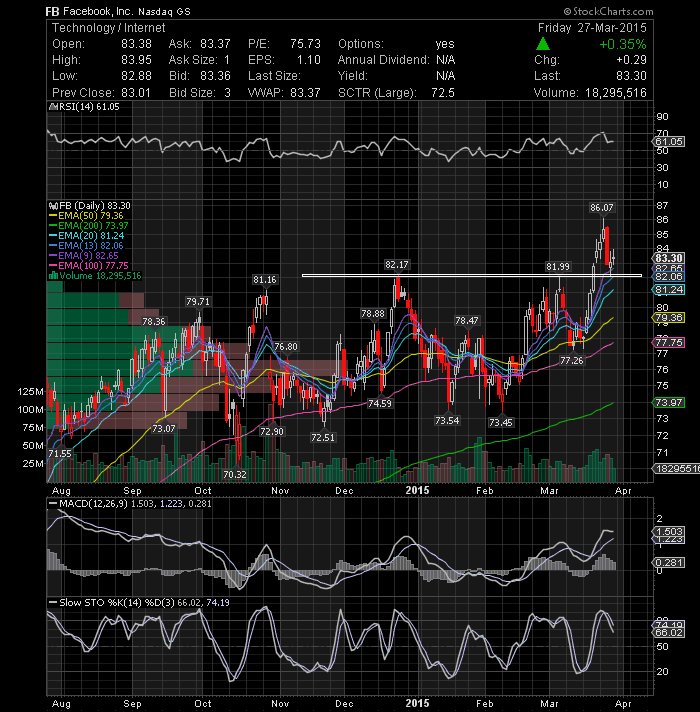
Facebook Inc (NASDAQ:FB) On the daily chart price has back tested successfully the breakout zone. Let's see if the price can hold above this key support area next week and move higher.
 ( click to enlarge )
Rambus Inc. (NASDAQ:RMBS) has a very interesting daily chart and could have a bigger move soon. The break of the next key resistance line with heavy volume should be the next buy point on Rambus. If it clears resistance at $12.88, the move may be powerful. Despite recent decline, the daily RSI remains above 60 levels and may support the bullish argument here. Additionally, the A/D line still show the stock is on the positive swing. On watch.
 ( click to enlarge )
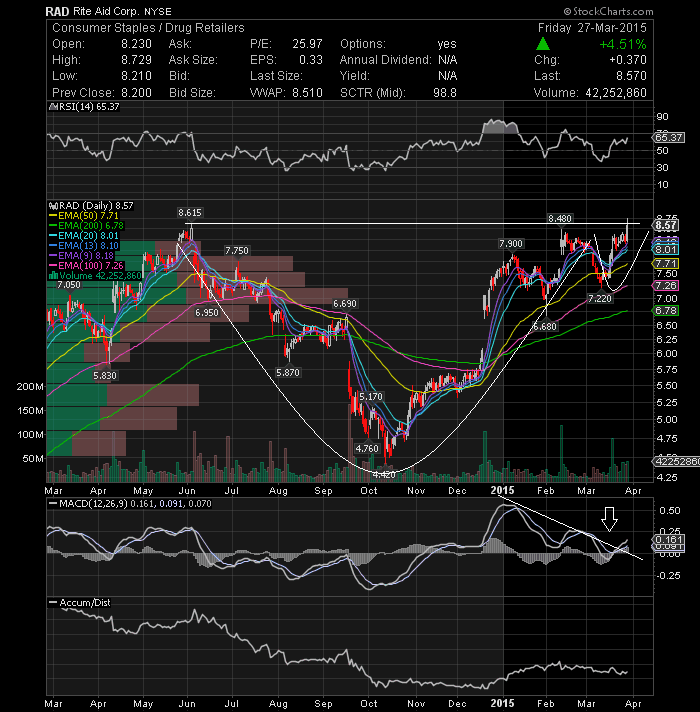
Rite Aid Corporation (NYSE:RAD) looks like it's getting ready to move. The price broke through its previous resistance point of 8.48, made a new 52-week high but failed to close above, however this was the first signal that I was looking for since a while. On the grand scale, in white, you will see a large cup and handle pattern and if broken the target will be around $12. Next key resistance is now located at $8.73 (yesterday's highs), a break above this level will confirm the bullish trend and the following uptrend will take price up to $9 zone.
 ( click to enlarge )
Ibio Inc (NYSEMKT:IBIO) should see some trading activity on Monday as investors interest continues to increase after yesterday's Reuters news wire: British Ebola patient cured after experimental treatment. MIL 77 is a close relative of another experimental medicine ZMapp. Resistance for the move is 78c (100EMA). This stock will move quickly and is very volatile, so be careful with your share size and entry price. I bought some shares on Friday..Let's see..This chart definetely looks like a bottom chart to me.
 ( click to enlarge )
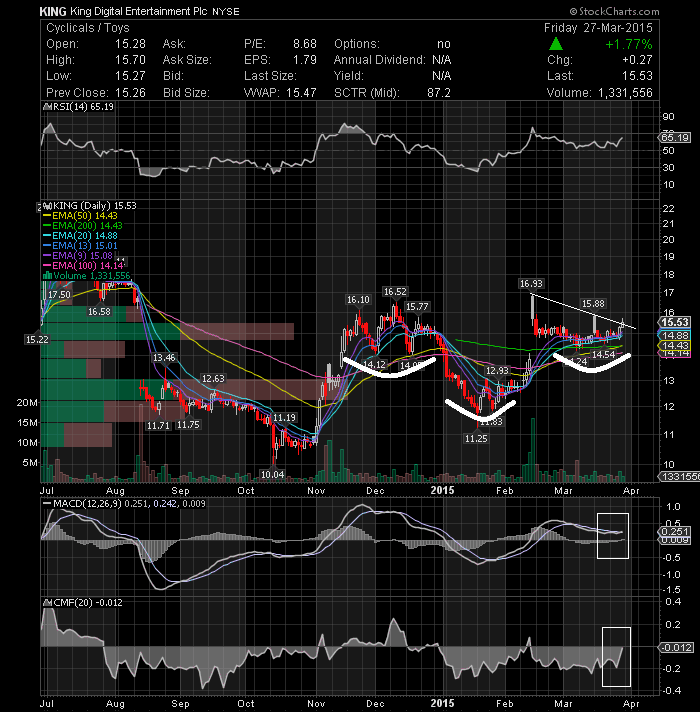
I've been stating fordays that King Digital Entertainment PLC (NYSE:KING) was trying to bottom. Last week the stock resumed a fresh up move after 2 weeks of consolidation and seems poised for a breakout above the 16 mark. On the grand scale, we can also see that there is also a Bullish inverted head and shoulders pattern developing with the neckline around 16.10. The recent high volume along with positive crossover of MACD on the daily charts suggest fresh buying interest in the stock. I'm Bullish on KING.
 ( click to enlarge )
ZIOPHARM Oncology Inc. (NASDAQ:ZIOP) had a signficant pullback last week that was stopped by its 50-day EMA at 10.62. Price needs to hold this key support area and break out above the 20-day EMA at 12.24 for a potential short-term uptrend move. The daily momentum indicators are showing mixed-signals with a positive bias.
 ( click to enlarge )
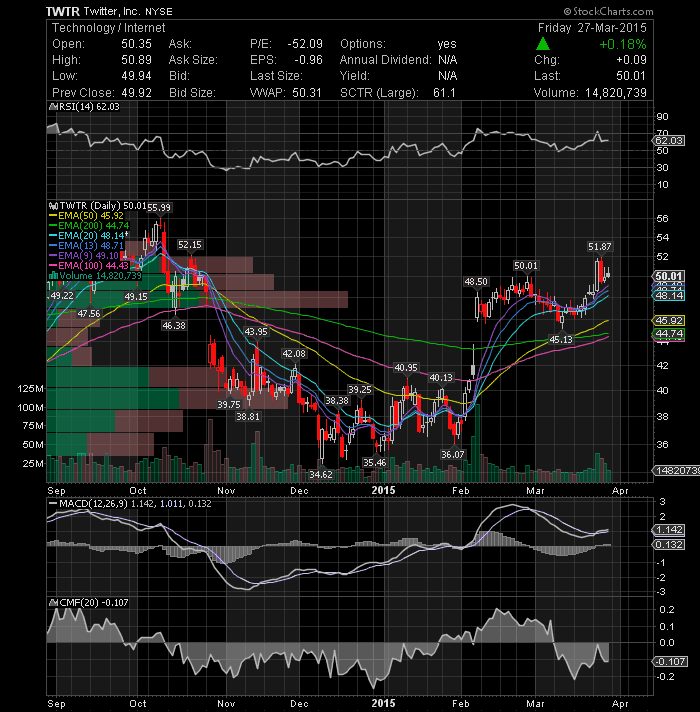
Twitter Inc (NYSE:TWTR) Price has been having wild swings since it broke the $50 level. The outlook remains positive supported by the EMAs and momentum indicators. Watch for a break out back above the 51.87 level which is Wednesday's high.
 ( click to enlarge )
Sirius XM Holdings Inc. (NASDAQ:SIRI) has been in correction mode the last couple of weeks. It needs to sustain above $3.81 to make a move to its recent high of $4.04. If it does not catch support here, look for support at the 100-day EMA at 3.70. On a short term basis, MACD and RSI show bearish signs.
 ( click to enlarge )
From my point of view, I think Kite Pharma Inc (NASDAQ:KITE) may break down here. Up/Down volume pattern indicates that the stock is under Distribution IMHO. The stock price closed fractionaly last week above the major support at $58, but any close below this level could have further negative implications for the stock, and a move to $50 cannot be ruled. At this time the price is still trading below short-term EMAs. In addition, falling MACD, now below 0, also indicates bearish trend. Fresh long positions, should be initiated only when the stock moves above $65.
Get insider tips and see live trading alerts every day. Whether you want to learn to trade full time or just generate an extra monthly income, I highly recommend also this service Vader Trades They use a top down strategy to trade futures, options, and stocks. Methodology is based on divergences, profiles, sentiment, and short term fundamental/event driven opportunities.
Disclaimer : This is not an investment advisory, and should not be used to make investment decisions. Information in AC Investor Blog is often opinionated and should be considered for information purposes only. No stock exchange anywhere has approved or disapproved of the information contained herein. There is no express or implied solicitation to buy or sell securities. The charts provided here are not meant for investment purposes and only serve as technical examples. Don't consider buying or selling any stock without conducting your own due diligence.
Thanks for visiting AC Investor Blog.
AC
