This could turn ugly . As predicted yesterday , without an upside catalyst, the indexes drifted lower and, as you can see from our Big Chart, we are testing a lot of critical lines – lines we expect to fail as the earnings reports come in and disappoint the bulls : Dow 18,020 is the 2.5% line, failing to get back over that and then failing the 50-day moving average at 17,915 can send us quickly back to the Must Hold line at 17,600. S&P 2,080 is the 12.5% line, so either the Dow is wrong and should easily plow higher or the S&P has a LONG way to fall. It's also the 50 dma, so a failure there would be TERRIBLE and the /ES Futures are already testing it (and that's a gain of $500 per contract from the short idea we gave you yesterday – you're welcome!). Nasdaq 4,988 is 30% over our Must Hold line in our own country's version of a bubble. We tested 5,000 yesterday and failed and it's all about AAPL's earnings on the 27th since it's 16% of the Nasdaq and 3.5% of the S&P and 5% of the Dow – so do or die on their earnings in two weeks. Meanwhile, I don't see many of the tech companies living up to the hype but NFLX has a chance to prove me wrong tomorrow (now $480) and INTC reports this evening. NYSE is the broadest measure of the markets and it's also barely above it's Must Hold line at 11,000 (11,057). That, of course, MUST HOLD or the other indices are very likely to go down with the big ship. The 50 dma is 10,946, so a bit below the line and that, of course, would be a very critical failure – hopefully that does not happen. Russell had been our upside leader but has run out of gas just 5% above our Must Hold line at 1,200. That makes 1,260 a very important line not to fail and the 50 dma is right at the 2.5% line at 1,232 and that's another one we'd hate to see tested. We are, of course, in CASH!!! - so we don't really give a…
 This could turn ugly.
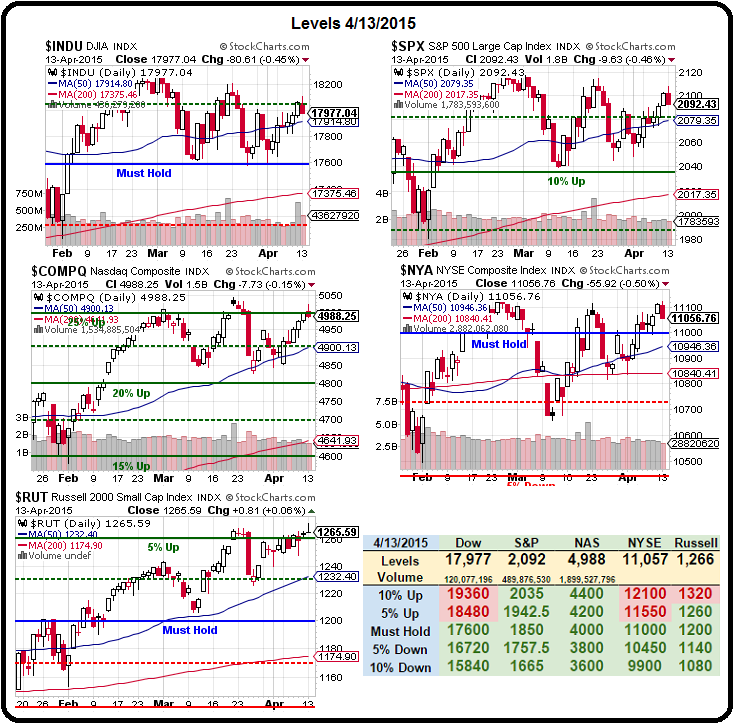
As predicted yesterday, without an upside catalyst, the indexes drifted lower and, as you can see from our Big Chart, we are testing a lot of critical lines – lines we expect to fail as the earnings reports come in and disappoint the bulls:
Dow 18,020 is the 2.5% line, failing to get back over that and then failing the 50-day moving average at 17,915 can send us quickly back to the Must Hold line at 17,600.
- S&P 2,080 is the 12.5% line, so either the Dow is wrong and should easily plow higher or the S&P has a LONG way to fall. It's also the 50 dma, so a failure there would be TERRIBLE and the /ES Futures are already testing it (and that's a gain of $500 per contract from the short idea we gave you yesterday – you're welcome!).
- Nasdaq 4,988 is 30% over our Must Hold line in our own country's version of a bubble. We tested 5,000 yesterday and failed and it's all about AAPL's earnings on the 27th since it's 16% of the Nasdaq and 3.5% of the S&P and 5% of the Dow – so do or die on their earnings in two weeks. Meanwhile, I don't see many of the tech companies living up to the hype but NFLX has a chance to prove me wrong tomorrow (now $480) and INTC reports this evening.
- NYSE is the broadest measure of the markets and it's also barely above it's Must Hold line at 11,000 (11,057). That, of course, MUST HOLD or the other indices are very likely to go down with the big ship. The 50 dma is 10,946, so a bit below the line and that, of course, would be a very critical failure – hopefully that does not happen.
- Russell had been our upside leader but has run out of gas just 5% above our Must Hold line at 1,200. That makes 1,260 a very important line not to fail and the 50 dma is right at the 2.5% line at 1,232 and that's another one we'd hate to see tested.
 We are, of course, in CASH!!! - so we don't really give a…


