
 You've gotta love those trend lines.
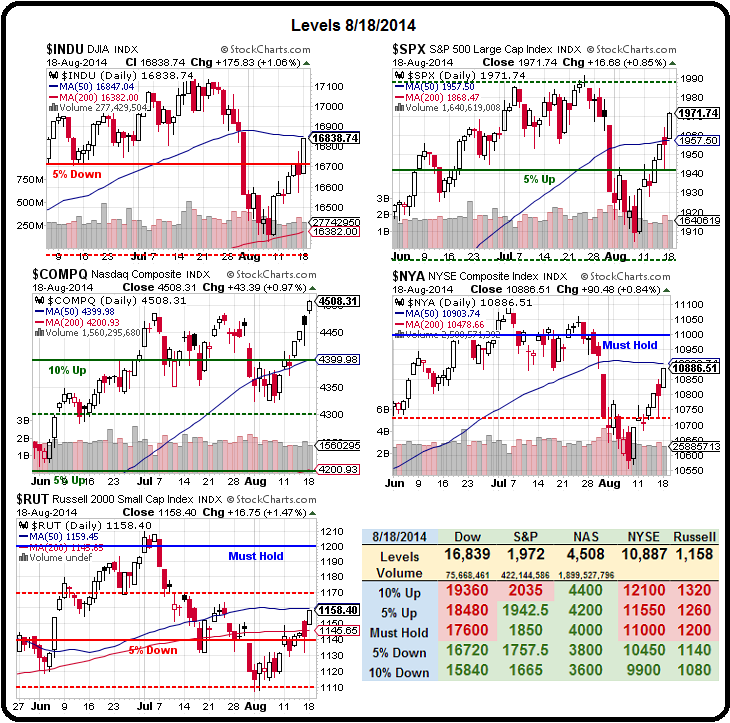
Chart people sure love them and we love chart peopel because they are SOOOOOOOO predictable and predictable behavior is behavior we can bet on and that makes us happy. Today we'll be seeing the 50-day moving averages on the Dow, the NYSE and the Russell all tested at the same time – what happens next will tell us a lot about this rally.
As I pointed out to our Members in our Live Chat Room this morning, though we may be past our bounce levels and though we are now challenging the 50 dmas, we still have 3 of 5 of our Must Hold levels red on the Big Chart – that's not too impressive. Consider what a 50-day moving average is. It means that, over the last 50 days, half the time the index has been above the line and half the time it's been below – so how impressive should it be to see the index back in the middle?
 Nonetheless, Chart People believe it's some mystical symbol that gives them a rally signal and half the time they are right – so the religion of TA continues to prosper! As you can see from Dave Fry's SPY chart from yesterday, 75% of yesterday's gain came on no volume as we gapped up in the Futures and the rest of the day's trading was one of the lightest of the year.
The reason I like Dave is because he's one of the only TA people who actually pay attention to volume and this volume is total BS. Still, it's enough to stampede the retail suckers back in and God bless them because they throw money at us to sell them the things we liked when they were out of favor.
In May and June, for example, we compiled a Buy List for our Members, which had 29 trades we liked for the rest of 2014. Here's a few that we are done with already:
…
