
Higher than expected, not directly a contributor to GDP or a measure of output.
The change in fed mtg regs that caused the blip and mtgs and subsequent reversal
needs to play out here as well:
Existing Home Sales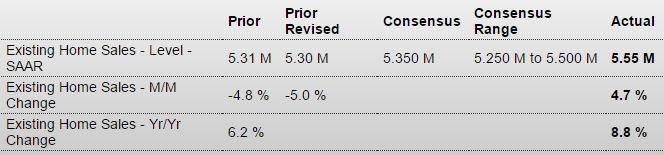
Highlights
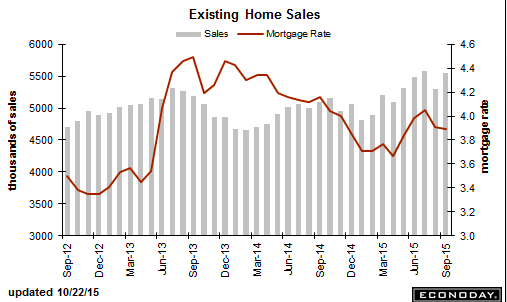
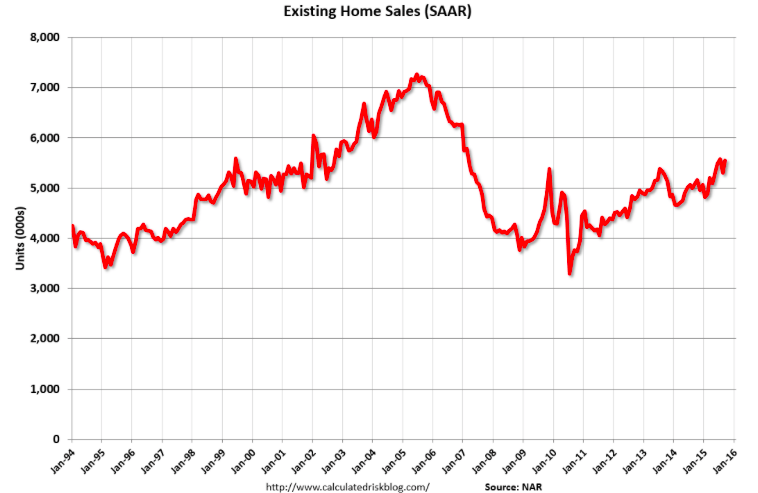
Existing home sales bounced back very strongly in September, up 4.7 percent to nearly reverse the prior month’s revised decline of 5.0 percent, a decline that now looks like an outlier on a steadily rising slope. The month’s annual sales rate, at 5.55 million, is just beyond Econoday’s top-end forecast while the year-on-year percentage gain, at plus 8.8 percent, is back where it was during the sales gains of the spring. This report is a big plus for the housing outlook, suggesting that demand for existing homes is nearly as strong as demand for new homes.
Yet another bad one here:
Chicago Fed National Activity Index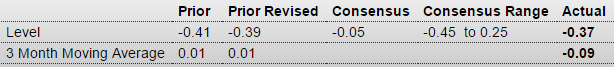
Highlights
September was a weak month across the economy. The national activity index came in at minus 0.37, a negative score that points to lower-than-average economic growth for the month. Production is the weakest component in the report, down 0.18 and reflecting in part export troubles in manufacturing. Sales/orders/inventories are at zero while the personal consumption & housing component is at minus 0.08. Employment is also in the negative column, at minus 0.11.
Weakness in September followed similar weakness in August where the index is at a revised minus 0.39. The 3-month average is at minus 0.09, down from plus 0.01 in August. This report is a reminder that, as long as economic data are weak, the doves can hold sway in the FOMC.
This hasn’t been useful with rates at 0 as the yield curve is one of its leading components.
But even with the positive yield curve its now gone negative: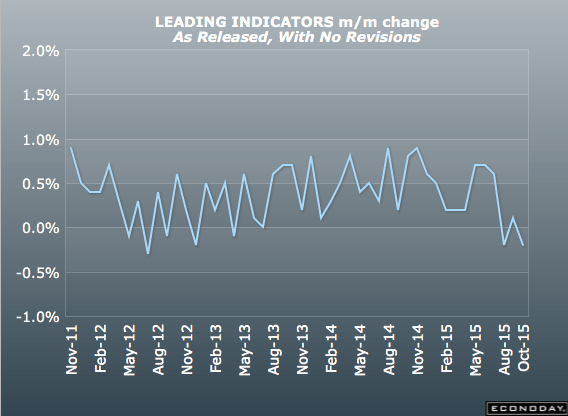
Still negative but not as negative:
Kansas City Fed Manufacturing Index
![]()
Highlights
The Kansas City manufacturing sector came up for badly needed air in October, ending a long run of deep contraction. The composite came in at only minus 1 which is an eighth straight decline but much improved from nearly double digit declines in prior months. The real positive is the new orders index which, at plus 7, ended nine dismal months of straight contraction. But backlogs, at minus 4, are in a 10th month of uninterrupted contraction with employment, at minus 3, in a ninth month of contraction. Orders will have to pick up before employment will turn higher. Other readings include a plus 4 for production, which hints at relative strength for October production and shipment data, and a negative 3 for finished goods prices in yet another negative indication on inflation. This report, coming from one of the weakest energy-hit regions of the economy, is a marginal plus for the manufacturing outlook.
The post Existing Home Sales, Chicago Fed, Leading Indicators, KC Fed appeared first on The Center of the Universe.
