
I like to step back to the weekly charts and try to understand how the bigger price moves unfold. To try and answer the question, "what signals the emergence of a potential super-performance stock?".
Which brings me to today's prime example of a market leader and super-performance stock in this ongoing bull market. Below is the chart of JAZZ, aka Jazz Pharmaceuticals, from 2008 to 2014.

Note the performance figures from the chart: JAZZ is now up 4,100% from its mid-2009 surge to the $3.50 level. If you had bought JAZZ at $0.80 as the market was bottoming in March 2009 and held to the present, you'd be sitting on a gain of 18,000%.
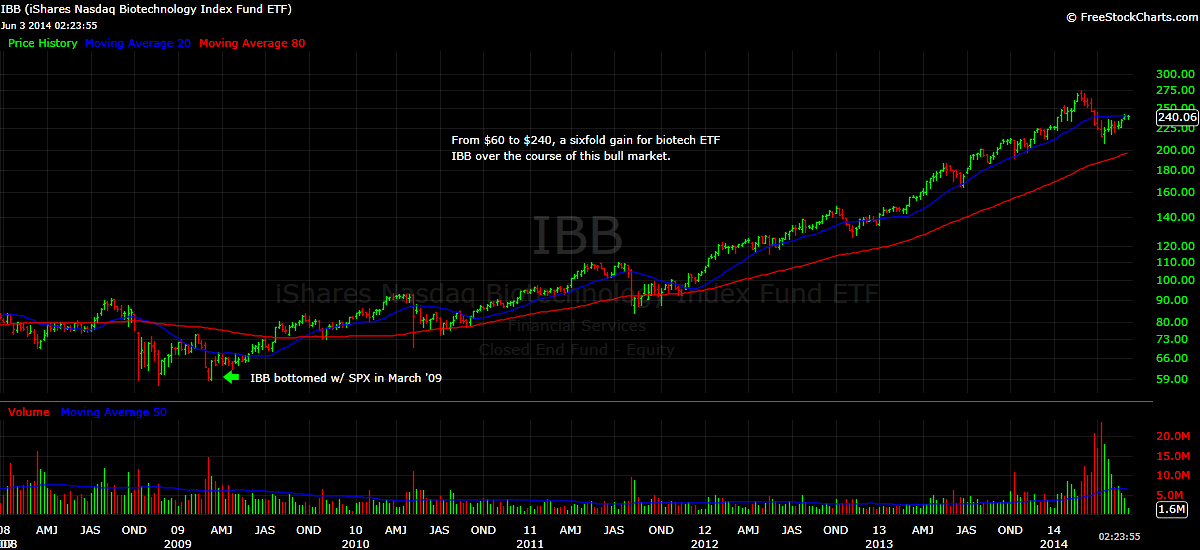
The biotech ETF, IBB has had a sixfold advance over the same time frame. So in this particular instance, you were well compensated for assuming single stock risk in a rather volatile sector.
Enough of the backward-looking hypotheticals. Let's quickly examine some of JAZZ's key chart points and market leading traits.
1. The S+P 500 and IBB both bottomed in March '09. JAZZ actually went on to make a lower low in April - May '09, then inched higher before surging in June '09 on massive volume.
2. JAZZ surged higher ahead of presentations and phase 3 data on its new drug (new product catalyst). The stock continued to rise as revenues and earnings estimates grew and as the company consistently beat earnings estimates.
3. After consolidating the initial price surge, JAZZ continued higher in the summer of 2009. Despite some 40% - 50% pullbacks and shakeouts the following year, JAZZ went on to make new highs in late 2010. As you'll see in the chart above, the entire uptrend was supported by the long-term 80 weekly moving average.
Some traders may prefer to trade smaller parts of these larger trends, weaving in and out to capture respectable profits along the way. Some may prefer to identify, buy, and hold key leading stocks (such as JAZZ) for longer durations. Either approach is fine, as long as you can define and follow your method.
Related posts:
1. Leading stocks: Tesla (TSLA) vs. GM chart review.
2. Mark Minervini: define and refine your approach.
