For the global VC industry, 2018 was a supergiant year. Crunchbase projects that 2018 deal and dollar volume surpassed even the high-water mark left by the dot-com deluge and the drought that followed.
As covered in Crunchbase News’s global VC report reviewing Q4 and the rest of 2018, projected deal volume rose by 32 percent and projected dollar volume jumped 55 percent since 2017. For all of 2018, Crunchbase projects that well over $300 billion was invested in equity funding rounds across all stages of the venture-backed company life cycle. (This figure includes an estimate of transactions that were finalized in 2018, but won’t be publicized or added to Crunchbase until later. More on how Crunchbase projects data can be found at the end of that report.)
Is the market mostly buoyed by the billions raised by the biggest private tech companies, or is a rising tide in this extended aquatic metaphor raising all ships? In other words, is the bulk of the capital going to only a handful of the largest rounds? That’s what the numbers show.
In the global VC pool, capital is definitely sloshing toward rounds totaling $100 million or more. In the chart below, you can see what percent of reported global VC dollar volume was raised in “supergiant” rounds versus deals of smaller size.
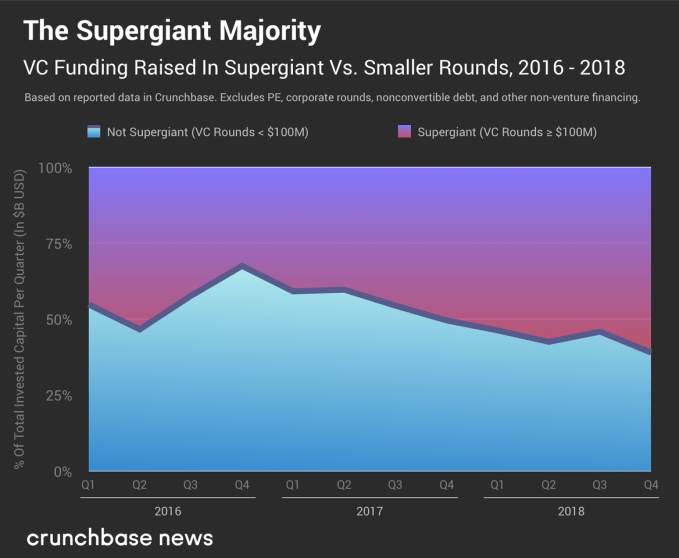
In the year, over 56 percent of worldwide dollar volume can be attributed to supergiant rounds. With 61 percent of reported capital coming from supergiants in the final quarter, Q4 2018 has the highest concentration of supergiant dollar volume of any single quarter on record.
Big money weighs on the marketFollowing that same theme, the calendar year 2018 is the most concentrated year on record. In the chart below, we show how much capital was raised in non-supergiant (<$100 million) venture rounds over the past decade. (It’s basically the bottom part of the first chart, with the data aggregated over a longer period of time.)

For the first time in at least a decade (and likely ever) supergiant, $100 million+ VC rounds accounted for a majority of reported capital raised. So in summary: Q4 2018 had the highest share of supergiant VC dollar volume on record, and 2018 was the most concentrated year on record.
On the one hand, the results are not surprising, considering that the biggest-ever VC round (a preposterously large $14 billion Series C raised by Ant Financial) and several rivals for that top spot were closed last year. That big round made a big splash. It was the year of multi-billion-dollar global growth funds, SoftBank and scooter CEOs worth supergiant sums, at least on paper. But was it good for the smaller players too?
Seed and early-stage deal and dollar volume were both up in 2018, but then again, so is everything toward the end of a bull market cycle. The question is, when the bottom falls out, between supergiant and more normal-sized rounds, which has the farthest to fall?
