
Factual Turns On Tools To Visualize Its Big Data
March 26, 2010 at 17:05 PM EDT

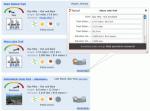
Big Data is great for geeks, but most normal people don't get a kick out of looking at huge tables of data (Excel junkies excluded). Factual , which is an open database wiki , just added some tools to help visualize the data entered on the site. Every table now has a "visualizations" tab which lets anyone who publishes a set of data an easy way to turn that data into graphs, maps, and images. For instance, here is a map view of a restaurant database. Here is one for hiking trails which shows a difficulty dial, the length of the route, today's weather, and which seasons the trail is open. Each visualization can be embedded as code onto a Website and is directly editable. For every entry there is an "edit this" button which lets anyone correct mistakes or add more information.
