
What were the early warning signs? We'll examine the stock charts of these two mortgage finance companies to see what went wrong. First, let's provide a little background on the firms and the lead-up to this recent mess.
Here's a quick summary from Housing Wire on the how and why of this interrelated financial unraveling:
"To say that Ocwen Financial (OCN) took a beating on Wall Street Tuesday would be the understatement of the century...Ocwen's stock closed Tuesday at $7.78, a loss of more than 36% for the day. One year ago today, Ocwen’s stock was trading at $55.20.
...Ocwen was under fire for most of last year, especially from the New York Department of Financial Services, which reached a settlement with Ocwen last month for failures in its mortgage servicing practices.
As part of the settlement, the NYDFS forced Erbey to resign from his position as chairman of the board of directors of Ocwen, and each of its four related companies: Altisource Portfolio Solutions S.A. (ASPS), Altisource Residential Corporation (RESI), Altisource Asset Management Corporation (AAMC), and Home Loan Servicing Solutions, Ltd. (HLSS), over allegations into Ocwen’s servicing practices and its relationships with its affiliated companies."
Just over a year ago, Bill Erbey's mortgage finance empire was the subject of flattering profiles in the financial press. Today OCN and ASPS both closed down over 36% and RESI is one of the few REITs starting the year off in negative territory. What a difference a year makes.
Here are the weekly charts of ASPS and OCN, shared earlier today on Twitter. I'll include some expanded charts below.
There were signs of weakness in the price action, charts of $OCN and $ASPS months ago. Will share a quick chart review.
— David Shvartsman (@FinanceTrends) January 13, 2015
Early signs of deteriorating price action in $ASPS. Annotated weekly chart: pic.twitter.com/sMjycQ8m63
— David Shvartsman (@FinanceTrends) January 13, 2015
$OCN sell-off followed similar pattern + warning signs as $ASPS. pic.twitter.com/uQpNJGkjil
— David Shvartsman (@FinanceTrends) January 13, 2015
While the deteriorating price action on the weekly charts may now seem obvious in hindsight, let's take note of some major clues (click charts to expand).
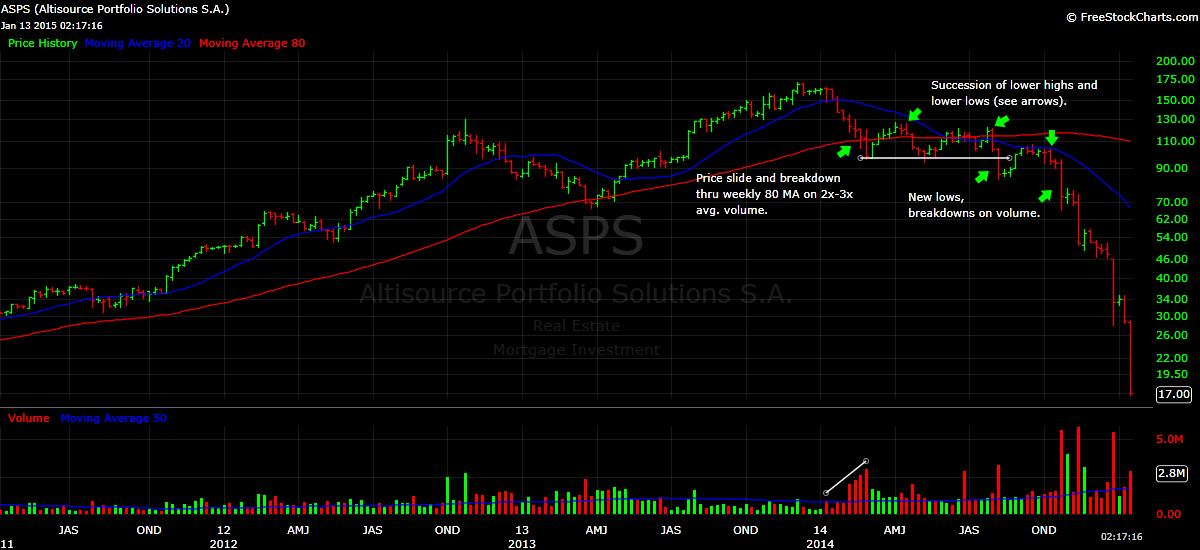

If you'll review the chart annotations, you'll see that ASPS and OCN both suffered a sharp multi-week sell-off on above average volume in early 2014. These sharp down moves resulted in breaks of ASPS and OCN's newly-formed 200 day moving averages, which could be seen in real-time on their daily charts. Later, a break below the weekly MAs would be evident in the weekly charts above.
Neither stock could successfully reclaim its previous highs and both continued to trade at new lows. OCN and ASPS continued to trade below their weekly moving averages for the remainder of 2014. You can clearly the see the pattern of lower highs and lower lows that took over. Each successive plunge to new lows came on high volume, a bearish sign indeed. Investors and institutions were saying, "get me out!".
Another late clue: as stronger stocks bottomed in October 2014 and went on to make new highs, ASPS and OCN both continued lower. Even at that late date, ASPS was trading near $50, while OCN traded above $21 through November.
A related stock, AAMC, popped up on my radar via manual daily stock scans in the summer and fall of 2014. While the price action looked bearish, I quickly scratched it as a short candidate; AAMC was a $600 stock that traded an average of just 20,000 shares a day.

To protect yourself from steep losses in stocks like ASPS and OCN, remember: every big drop starts as distribution and a smaller decline. It's up to us to as traders and investors to manage our risk and decide beforehand where we will cut our losses.
Disclosure: I have no long or short positions in any of the stocks mentioned at this time.
