
Mexichem, S.A.B. de C.V. (BMV:MEXCHEM*) (“the Company” or “Mexichem”) today announced its unaudited results for the first quarter of 2017. The figures have been prepared in accordance with International Financial Reporting Standards (“NIIF” or “IFRS”), having US dollars as the functional and reporting currency. All comparisons are made against the same period of the prior year. Unless specified to the contrary all figures are in millions. In some cases, percentages and numbers have been rounded.
This Smart News Release features multimedia. View the full release here: http://www.businesswire.com/news/home/20170426006849/en/

Sales by Region (Graphic: Business Wire)
Given that Mexichem’s reported earnings results (including the impact of the asset write-off related to the accident at PMV’s VCM plant) differ substantially from its reported operating results (without the write-off), for clarification purposes, since the incident the Company´s quarterly reports have contained reported EBIT, EBITDA and net income including the one-time net effect related to PMV´s VCM plant, as well as *Adjusted EBIT, EBITDA and net income which exclude that effect. In the 1Q17 the only effect recorded was business interruption insurance coverage. As the business interruption insurance is not considered to be a one-time effect, the report for 1Q17 does not include a presentation of adjusted figures.
Please note that the presentation of Mexichem’s 2016 first quarter results reflect the effects of several actions taken by the Company in 2016 and in the first quarter of 2017. A detailed review of these actions and their impact can be found on Page 14 of this release. It is highly recommended that you read these Clarifications prior to analyzing the Company´s 1Q17 results.
First Quarter 2017 Financial and Operating Highlights
- Consolidated revenues increased 11% to $1.4 billion;
- EBITDA increased 3% to $207 million;
- On a constant currency basis, consolidated revenue and EBITDA increased 13% and 5%, respectively (tables on pg.16);
- Net majority income was $52 million, representing TTM ROE of 7.9% and ROIC of 6.3%;
- Company Re-Affirms its Guidance of 10% to 20% EBITDA growth in 2017 based on 2016 reported EBITDA of $884 million.
CONSOLIDATED SELECTED FINANCIAL RESULTS
| First Quarter | |||||||||
| Consolidated (mm US$) | 2017 | 2016 | %Var. | ||||||
| Net Sales | 1,395 | 1,258 | 11% | ||||||
| Operating Income | 123 | 122 | 1% | ||||||
| EBITDA | 207 | 202 | 3% | ||||||
| EBITDA Margin | 14.8% | 16.0% | -120 | ||||||
| Net Majority Income | 52 | 58 | -10% | ||||||
| Operating Cash Flow Before Capex | 5 | 45 | -89% | ||||||
| Total CAPEX (organic & JV) | -82 | -110 | -25% | ||||||
| Free Cash Flow | -103 | -79 | 31% | ||||||
MANAGEMENT COMMENTARY
Performance and Outlook
We are pleased to report that first quarter results were in line with our expectations and have set the stage for significant growth in 2017. Improved market dynamics, together with Mexichem’s leadership positions across the value chain, resulted in significant revenue growth in the period, particularly in our Vinyl Business Group. The positive impact of higher prices and increased demand on both revenues and EBITDA will be even more pronounced in upcoming periods, as further price increases take effect in our Fluor and Fluent Business Groups as well. Consolidated EBITDA increased at a low single-digit rate, as double-digit growth in the Resins, Compounds and Derivatives business unit of Vinyl Business Group was partially offset by quarter-specific items, including the lag time associated with cost pass-throughs to Fluent and Compounds customers. The increased profitability of Resins coincident with the short term pullback in Fluent’s profitability illustrates the reduced volatility that vertical integration provides Mexichem. With the seasonally slowest period behind us, we expect to see substantial improvement in EBITDA and EBITDA margin comparisons throughout 2017.
Our Vinyl Business Group was a key driver of consolidated revenue and EBITDA growth in this year’s first quarter, leading the way with double-digit year-on-year comparisons for both metrics. The Group’s increased profitability reflected improved pricing and higher volumes. The cracker’s performance supports our expectation that it will increasingly contribute to improving our cost position. Additionally our Compounds business unit benefited from the strategic acquisition of Vinyl Compounds, which we completed in 2016.
In Fluor, sales were virtually flat on a year-on-year basis, but EBITDA increased at a mid-single digit rate, primarily due to a more favorable product mix, including a larger contribution from and higher prices for that portion of our refrigerant gas production that we sell on the spot market. We expect to continue to benefit from increasing refrigerant gas prices throughout the year, as existing contracts are re-priced and customers draw down inventories built in the third and fourth quarters of 2016. The Group’s EBITDA results also should reflect higher volumes and a more favorable product mix in our upstream fluorspar business.
Sales in Fluent Business Group increased across all regions in which we operate. At the EBITDA level, both the U.S. and Europe posted positive year-on-year comparisons. This performance was offset by lower EBITDA results in LatAm, which was mainly due to the lag-time associated with passing through price increases to customers as well as certain items specific to the first quarter, including, restructuring charges and increased reserves. Fluent’s EBITDA performance is set to rebound in the second quarter as higher raw material costs are passed through to customers, and as the Group continues to take advantage of cross sell opportunities in specialty products and implements ongoing operating efficiency programs.
First quarter net majority income was $52 million, representing a trailing twelve month adjusted for PMV’s effect net income ROE of 7.9% and ROIC of 6.3%. As anticipated, capital expenditures declined by 25% in the first quarter, now that our investment in the cracker is mostly completed. We ended the first quarter in a strong financial position, with a net debt to equity ratio of 1.9x and a cash position of $597 million, providing Mexichem with the flexibility to invest in internal growth projects and consider strategic acquisitions.
In summary, our first quarter results were a solid start to what we expect will be a very positive year for Mexichem. We have a clear roadmap to EBITDA growth of 10% to 20% respect to the reported EBITDA of $884 million in 2016, which involves prioritizing returns on investment, managing our new cost structure with the benefit of the cracker and continuing to build upon our specialty product portfolio to drive organic growth.
REVENUES
First quarter 2017 revenues were $1.4 billion, up 11% from 1Q16. Of the $137 million increase, $97 million came from our Resins, Compounds and Derivatives business units and $40 million from our Fluent Business Group.
Sales growth in our Resins, Compounds and Derivatives business units, was driven by better PVC demand growth, mainly in Asia and Europe which helped increase volumes, as well as better PVC pricing cycle trends, and the acquisition of Vinyl Compounds for our Compounds business during 4Q16.
The $40 million increase in our Fluent Business Group revenues were mainly supported by our LatAm and US/Canada operations where sales increased by $24 million and $16 million year-on-year, respectively. The appreciation of the Brazilian Real against the US Dollar also contributed to the positive sales results in LatAm region.
Fluor Business Group revenues reported a slight decline. Better pricing trends in downstream were partially offset by lower prices in the upstream business.
On a constant currency basis, revenues would have increased 13% or $161 million, mainly the result of the appreciation of the US Dollar against the British Pound. During 1Q17 the exchange rate translation effect reduced sales by $24 million.
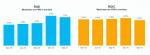
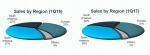
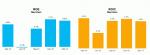
SALES BY REGION
The United States represented 16% of total sales, Brazil accounted for 6%, and the UK and Germany represented 8% and 14%, respectively.
EBITDA
EBITDA in 1Q17 was $207 million, an increase of 3% compared to $202 million in the first quarter last year, while EBITDA margin was 14.8%. Results were mainly supported by Resins, Compounds and Derivatives within the Vinyl Business Group and Fluor Business Groups where EBITDA increased by $7 million and $2 million, respectively. This was driven by better PVC prices and refrigerant gases market conditions associated with the recovery of the PVC cycle and the effect of the ITC resolution announced by the Company on March 23rd, 2017. Results were partially offset by a $5 million EBITDA decline in our Fluent Business Group as a result of higher PVC prices, increases in the reserve for doubtful accounts and restructuring costs in our LatAm Fluent Business unit.
On a constant currency basis, reported EBITDA would have been $211 million, an increase of 5% from 1Q16 and the EBITDA margin 14.9%.
OPERATING INCOME
For the first quarter of 2017, Mexichem reported operating income of $123 million, implying a 1% increase year over year. The increase in operating income was mainly the result of the factors mentioned above.
FINANCIAL COSTS
In 1Q17 financial costs increased by $2 million, or 4% compared to 1Q16 to $45 million. The increase is mainly due to an FX loss of $14 million, which resulted from the Mexican peso denominated debt which was offset by:
- FX gain of $6 million related to our net liabilities in currencies other than the US dollar.
- A hyperinflationary effect of $6 million in our Venezuelan operation.
TAXES
In 1Q17 the effective tax rate was 31% compared to 27% in 1Q16, mainly as a result of a reduction in the deferred tax charges from $18 million in 1Q16 to $5 million. This was due to the usage of net operating losses against a taxable income associated with inflationary and FX effects.
The cash tax rate declined to 38% in the 1Q17 from 50% in 1Q16 due to a combination of: i) a change in the mix of Mexichem companies that generate net gains and those with net losses, within the consolidated figures of the Company and ii) the corporate tax rates that those companies are obliged to pay.
MAJORITY INCOME (LOSS)
In 1Q17, the Company reported net majority income of $52 million, compared to a net majority income of $58 million in 1Q16.
OPERATING CASH FLOW HIGHLIGHTS
| First Quarter | |||||||||
| 2017 | 2016 | %Var. | |||||||
| EBITDA | 207 | 202 | 3% | ||||||
| One time non-cash Items | 0 | 0 | |||||||
| Cash Tax | -29 | -40 | -26% | ||||||
| Net Interest | -40 | -39 | 0% | ||||||
| Bank Commissions | -2 | -2 | 0% | ||||||
| Monetary Position and Exchange Rate Losses | 11 | -4 | N/A | ||||||
| Change in Trade Working Capital | -141 | -72 | 97% | ||||||
| Operating Cash Flow Before Capex | 5 | 45 | -89% | ||||||
| CAPEX (Organic) | -48 | -50 | -2% | ||||||
| CAPEX (Total JV) | -62 | -104 | -40% | ||||||
| CAPEX JV (OXY SHARE) | 28 | 44 | -35% | ||||||
| NET CAPEX JV | -34 | -60 | -44% | ||||||
| Total CAPEX (organic & JV) | -82 | -110 | -25% | ||||||
| Cash Flow | -77 | -65 | 18% | ||||||
| Dividends | -26 | -14 | 86% | ||||||
| Free Cash Flow | -103 | -79 | 31% | ||||||
- The increase in EBITDA and monetary position as well as the reduction in cash taxes during the first quarter helped offset the increase in working capital needs during the period. Working capital increased mainly due to a $190 million increase in account receivables compared to the prior year, as a result of the important growth in sales we registered during the period.
- Capital expenditures in 1Q17 decreased by 25% to $82 million, $28 million of which was invested in the ethylene cracker, $6 million as carryover in PMV, and $48 million allocated to organic projects.
As of March 31, 2017, Mexichem’s equity investment in the ethylene cracker reached $716 million, which represents 96% of the total equity investment that Mexichem contracted with OxyChem to gain a 50% stake in the joint venture. As of the 1Q17 there are certain start-up expenses related to the ethylene cracker.
NET WORKING CAPITAL
| 2017 Variation | 2016 Variation | |||||||||||||||||
| mar-17 | dec-16 | D ($) | mar-16 | dec-15 | D ($) | |||||||||||||
| Working Capital | 326 | 184 | -141 | 318 | 246 | -72 | ||||||||||||
The Net Working Capital balance as of March 31, 2017 when compared to the same period last year reflected an $8 million increase in working capital requirements.
FINANCIAL DEBT
| Last Twelve Months | ||||||
| Mar 2017 | Dec 2016 | |||||
| Net Debt USD | 1,720 | 1,587 | ||||
| Net Debt/EBITDA 12 M | 1.9x | 1.8x | ||||
| Net Debt/Adj EBITDA 12 M | 1.8x | 1.7x | ||||
| Interest Coverage | 4.6x | 4.6x | ||||
| Adj Interest Coverage | 4.9x | 4.8x | ||||
| Outstanding Shares (Million) | 2,100 | 2,100 | ||||
Total financial debt as of March 31, 2017 was $2.3 billion, plus $1.4 million in letters of credit with maturities of more than 180 days for a total financial debt of $2.3 billion, while cash and cash equivalents totaled $597 million, resulting in net financial debt of $1.7 billion.
The Net Debt/EBITDA ratio was 1.9x at March 31, 2017, while the Interest Coverage was 4.6x. The Net Debt /Adjusted EBITDA ratio was 1.8x and Adjusted Interest Coverage was 4.9x. Adjusted EBITDA in this case excludes the on-time charge accrued in 2Q16, the one-time benefit net of expenses accrued in 3Q16, and the benefit from our assembly insurance coverage included in the property policy at the PMV plant recognized in the 4Q16.
CONSOLIDATED BALANCE SHEET
| USD in thousands | ||||||
| Balance Sheet | Mar 2017 | Dec 2016 | ||||
| Total assets | 8,519,430 | 8,354,015 | ||||
| Cash and temporary investments | 597,052 | 713,607 | ||||
| Receivables | 1,054,813 | 847,509 | ||||
| Inventories | 662,591 | 606,389 | ||||
| Others current assets | 440,409 | 392,698 | ||||
| Long term assets | 5,764,565 | 5,793,812 | ||||
| Total liabilities | 4,811,478 | 4,772,409 | ||||
| Current portion of long-term debt | 62,382 | 57,693 | ||||
| Suppliers | 1,391,788 | 1,269,704 | ||||
| Other current liabilities | 590,266 | 657,600 | ||||
| Long-term debt | 2,253,474 | 2,241,370 | ||||
| Other long-term liabilities | 513,568 | 546,042 | ||||
Consolidated shareholders' equity | 3,707,952 | 3,581,606 | ||||
Minority shareholders' equity | 938,975 | 903,812 | ||||
Majority shareholders' equity | 2,768,977 | 2,677,794 | ||||
| Total liabilities & shareholders' equity | 8,519,430 | 8,354,015 | ||||
Financial Assets
On April 20th, 2016, an explosion occurred in the VCM plant inside the Petrochemical Complex Pajaritos, where two of the three facilities of PMV are located (VCM and Ethylene). The chlorine and caustic soda plant is located on a separate site. There was no damage to the chlorine-caustic soda plant, but there was business interruption in the supply of raw material. The VCM plant (Clorados III) is the one that sustained most of the damage, the major economic impact of which was the write-off of the asset and the shutdown of that plant.
Mexichem’s assets including those in PMV are adequately insured at today’s replacement value, while the related non-cash charge was calculated at book value. The Company’s insurance coverage includes: i) environmental responsibility, ii) damage to property, iii) damage to assets during assembly process, iv) business interruption, v) liability for damage to third parties, and vi) liability of directors and officers.
During FY16 PMV recognized, $287 million related to asset write off, of which $276 million and $9 million were recognized in other expenses and other comprehensive income (equity), respectively; and $42 million related to amounts of indemnifications, legal expenses, and other costs, which represented a charge of $318 million.
During the third quarter of 2016, PMV gathered sufficient information to decide to recognize the account receivable related to insurance coverage, which for the full year amounted $276 million related to property damage, assembly insurance coverage, third party expenses, and expenses incurred under directors’ and officers’ coverage. The onetime expenses were offset by the full year account receivable which generated a net expense effect of $42 million. In FY16 PMV recognized a $20 million benefit from its assembly insurance coverage.
Finally, during FY16 and 1Q17 PMV and Resins, Compounds and Derivatives recognized income of $51 million and $17 million respectively, for business interruption that offset fixed costs that were not absorbed and its margin.
PMV has presented its claims to its insurance companies, however the vast majority of them have not been recovered yet.
Contingent Asset
PMV together with its shareholders, Mexichem & Pemex, are evaluating several strategic options for the business in the future, reason why the Company adopted a conservative policy with respect to the monetary amount recognized in the account receivable, reflecting the stated cash value of the plant as of December 31st 2015. When the business plan is finalized, the exact dollar amount of the account receivable could change.
Contingent Liability
As a result of the VCM Plant (Clorados III) incident described in the contingent asset disclosure, PMV performed an environmental assessment to determine if any pollutants were deposited in areas surrounding the facility, delivered the report to the environmental authorities and is working with them in order to determine, if any, the environmental damages. Also PMV could be responsible for third party injuries, if any. Based on the information the Company has as of this report, there is no evidence that there are additional relevant liabilities.
As mention previously, depending on the decision taken by PMV and its shareholders, once the business future is decided, PMV will evaluate the impacts in the rest of its assets in Pajaritos Complex. The remaining fixed asset value of the PMV’s plants inside Pajaritos Complex is $213 million as of December 31, 2016.
CONSOLIDATED INCOME STATEMENT
| USD in thousands | First Quarter | ||||||||
| INCOME STATEMENT | 2017 | 2016 | % | ||||||
| Net sales | 1,394,993 | 1,258,323 | 11% | ||||||
| Cost of sales | 1,096,931 | 961,355 | 14% | ||||||
| Gross profit | 298,062 | 296,968 | 0% | ||||||
| Operating expenses | 175,335 | 175,046 | 0% | ||||||
| Operating income | 122,727 | 121,922 | 1% | ||||||
| Financial cost | 45,342 | 43,411 | 4% | ||||||
| Equity in income of associated entity | (488) | (927) | -47% | ||||||
| Income from continuing operations before income tax | 77,873 | 79,438 | -2% | ||||||
| Cash tax | 29,448 | 39,951 | -26% | ||||||
| Deferred taxes | (5,077) | (18,375) | -72% | ||||||
| Income tax | 24,371 | 21,576 | 13% | ||||||
| Income from continuing operations | 53,502 | 57,862 | -8% | ||||||
| Discontinued operations | (179) | (398) | -55% | ||||||
| Consolidated net income | 53,323 | 57,464 | -7% | ||||||
| Minority stockholders | 1,399 | (279) | N/A | ||||||
| Net income | 51,924 | 57,743 | -10% | ||||||
| EBITDA | 207,016 | 201,815 | 3% | ||||||
OPERATING RESULTS BY BUSINESS GROUP
VINYL Business Group (42% and 43% of Mexichem’s sales (before eliminations) and EBITDA respectively, in 2017)
| First Quarter | |||||||||
| Vinyl | 2017 | 2016 | %Var. | ||||||
| Volume (K Tons) | 646 | 636 | 2% | ||||||
| Total Sales* | 599 | 499 | 20% | ||||||
| Operating Income | 56 | 46 | 22% | ||||||
| EBITDA | 88 | 79 | 12% | ||||||
| *Intercompany sales were $45 million and $40 million in 1Q17 and 1Q16, respectively. |
| First Quarter | |||||||||
| Resins, Compounds & Derivatives | 2017 | 2016 | %Var. | ||||||
| Volume (K Tons) | 578 | 552 | 5% | ||||||
| Total Sales* | 583 | 486 | 20% | ||||||
| Operating Income | 49 | 43 | 14% | ||||||
| EBITDA | 75 | 68 | 10% | ||||||
| *Intercompany sales were $51 million and $49 million in the 1Q17 and 1Q16, respectively. Of these amounts $6 million and $9 million were invoiced to PMV in 1Q17 and 1Q16, respectively. |
| First Quarter | |||||||||
| PMV | 2017 | 2016 | %Var. | ||||||
| Volume (K Tons) | 76 | 142 | -46% | ||||||
| Total Sales* | 23 | 44 | -47% | ||||||
| Operating Income | 7 | 3 | 133% | ||||||
| EBITDA | 13 | 11 | 21% | ||||||
| *Intercompany sales invoiced to Resins, Compounds and Derivatives were $1.2 million and $23 million in 1Q17 and 1Q16, respectively. |
In 1Q17, the Vinyl Business Group reported a 2% increase in volumes, and 20% growth in sales to $599 million. This growth is the result of better trends in the PVC cycle which benefited prices, increased PVC demand, notably in Asia and Europe, and our strategic acquisition of Vinyl Compounds for our Compounds business.
EBITDA for the Vinyl Business Group increased by 12% to $88 million, mainly as a result of the improved trends mentioned above, a better product mix and efficiencies in our operations. EBITDA margin was 14.7%. The cracker’s performance supports our expectation that it will increasingly contribute to improving our cost position. In 1Q17, Resins, Compounds and Derivatives volumes and revenues increased 5% and 20% year-on-year, respectively. Revenues benefited from better PVC market conditions (demand growth and prices) and our strategic acquisition of Vinyl Compounds. 1Q17 EBITDA for Resins, Compounds and Derivatives was $75 million, representing growth of 10% compared to the same quarter last year. Operating income for Resins, Compounds and Derivatives was $49 million, an increase of 14% from the first quarter in 2016.
In 1Q17, PMV sales were $23 million, from the majority of which came from our chlorine-caustic soda operations. Reported EBITDA in PMV was $13 million in 1Q17 which reflects the recognition of $17 million related to the business interruption coverage.
FLUENT Business Group (49% and 38% of Mexichem’s sales (before eliminations) and EBITDA, respectively, in 2017)
| First Quarter | |||||||||
| Fluent | 2017 | 2016 | %Var. | ||||||
| Sales | 703 | 662 | 6% | ||||||
| Fluent LatAm | 272 | 248 | 10% | ||||||
| Fluent Europe | 302 | 293 | 3% | ||||||
| Fluent US/Canada | 100 | 84 | 19% | ||||||
| Fluent AMEA | 36 | 40 | -10% | ||||||
| Intercompany Eliminations | (8) | (3) | 138% | ||||||
| Operating Income | 43 | 52 | -19% | ||||||
| EBITDA | 79 | 83 | -6% | ||||||
Management has decided to disclose AMEA operations separate from US/Canada operations as part of a restructuring process in the Fluent Business Group.
In 1Q17, the Fluent Business Group reported a 6% increase, or $41 million increase in sales, despite the negative impact of $11 million related to exchange rate translation effect associated with the appreciation of the U.S. dollar against some currencies like the Euro and the British Pound. The Brazilian real appreciation helped offset part of the currency impact as well as better pricing in some of our LatAm operations. The Fluent Business group has continued to take actions to diversify its end markets.
| 1Q16 | In million dollars | 1Q17 | Sub17 | Sub17/1Q16 | ||||||
| Revenues | Revenues | FX | Total | % Var Comp | ||||||
| 248 | Fluent LatAm | 272 | -10 | 263 | 6% | |||||
| 293 | Fluent Europe | 302 | 21 | 322 | 10% | |||||
| 84 | Fluent US/Canada | 100 | 0 | 100 | 19% | |||||
| 40 | Fluent AMEA | 36 | 0 | 36 | -11% | |||||
| -3 | Intercompany Eliminations | -8 | 0 | -8 | 138% | |||||
| 662 | Total | 703 | 11 | 713 | 8% | |||||
On a constant currency basis, total sales in the Fluent Business Group would have been $713 million, an 8% increase year over year.
First quarter EBITDA was $79 million, a 6% decrease mainly as a result of higher PVC prices, as well as the increases in reserves for doubtful account and restructuring costs in LatAm. Efficiencies in Europe and US were more evident during the quarter.
On a constant currency basis, EBITDA decreased 3%, to $81 million and EBITDA margin would be 11.4% instead of 11.2%.
FLUOR BUSINESS GROUP (10% and 24% of Mexichem’s sales (before eliminations) and EBITDA, in 2017)
| First Quarter | |||||||||
| Fluor | 2017 | 2016 | %Var. | ||||||
| Sales | 138 | 139 | -1% | ||||||
| Operating Income | 38 | 36 | 6% | ||||||
| EBITDA | 51 | 49 | 4% | ||||||
In 1Q17 the Fluor Business Group reported a 1% decrease in sales, reflecting changes in the product mix. The effect in downstream is mainly a result of the ITC resolution announced by Mexichem on March 23th, 2017 where clients increased inventories in 3Q16 and 4Q16 with the expectation of a resolution in 1Q17. We continued to successfully diversify end markets, with the cement industry performing well and showing a positive trend coming since the 2Q16.
The Fluor Business Group reported EBITDA of $51 million, with an EBITDA margin of 36.6%. Operating income was $38 million, a 6% year over year increase.
Clarifications
- As reported in 4Q16, as part of our core strategy of shifting to higher margin products in our Fluent Business Group, at the end of 1Q16 we decided to exit from our pressure pipe business in the US, which impacted our Fluent US/ AMEA Business. This decision was made in order to shift our capacity from pressure pipes, where products have low margins to Datacom, where margins are higher. As a result, our 1Q16 consolidated figures and Fluent segment figures differ from those presented in this report. This is due to the reclassification of Fluent’s pressure pipe business as discontinued operations, which had a net effect of $4 million on revenues and $1.4 million on EBITDA during 1Q16
-
In 2016, Mexichem performed an analysis to determine whether the
company is the “agent” or “principal” in terms of IAS 18 Revenue, in
order to determine how freight costs should be recorded and reported
on our P&L. The conclusion was that the company is “principal” and
that freight costs should be included in Cost of Goods Sold (COGS)
instead of Sales, General and Administrative Expenses (SG&A), as it
was during the first three quarters of 2016 and in previous years.
Consequently, in the fourth quarter of 2016, we reclassified the FY16
freight costs from SG&A to COGS.
The freight costs related to the 1st, 2nd, 3rd and 4th quarters of 2016 were $73 million, $79 million, $78 million and $70 million, respectively. For the 2016 1st, 2nd, and 3rd quarters freight costs impacted 4Q16 COGS. This reclassification does not have any effect in EBITDA, but it does have an effect on reported gross profit.
The restructured figures with the abovementioned effects are shown in Appendix I.
- Effective 1Q17, management has decided to separate reporting of the Fluent Group’s US and AMEA operations. From this quarter forward we will report four business regions for Fluent, namely: LatAm. Europe, US and AMEA.
- As announced in our 4Q16 earnings report, Mexichem’s Audit Committee and Board of Directors have authorized a change in the Company’s accounting policy related to fixed asset valuation from the revaluation method to the historical cost recognition method. Effective in 1Q17, Mexichem reduced its fixed assets by $452 million, deferred taxes by $136 million and equity value by $316 million on its balance sheet by eliminating the revaluation value that has been accrued since Mexichem adopted IFRS in 2010. For comparative purposes, starting with this quarterly report, and during 2017, Mexichem will include Appendix 1 and Appendix II in its quarterly information showing the 2016 changes in depreciation on the Income Statement, as well as the changes in fixed assets, deferred taxes and equity value on its Balance Sheet as if the accounting policy change would have been authorized in 1Q16. Additional details are contained on page 18.
- On February 27th, Mexichem announced that its ethylene cracker 50/50 joint venture with Occidental Chemical Corporation (OxyChem), a subsidiary of Occidental Petroleum Corporation (NYSE:OXY), which is located at OxyChem’s Ingleside, Texas complex, began operations on schedule and on budget. The ethylene cracker is currently in a production stabilization phase. The cracker, which will be operated by OxyChem, has the capacity to produce 1.2 billion pounds (550,000 metric tons) of ethylene per year and provide OxyChem with an ongoing source of ethylene for manufacturing vinyl chloride monomer (VCM), which Mexichem will use to produce polyvinyl chloride (PVC resin) and PVC piping systems. The companies have a 20-year supply agreement. Due to this, all the figures in this report, include the results of Ingleside Ethylene, LLC.
RECENT EVENTS
For all the news please visit the following webpage http://www.mexichem.com/news/
Conference Call Details:
Mexichem will host a conference call to discuss its 1Q17 results on April 27, 2017 at 10:00 am Mexico City /11:00 NY. To access the call, please dial 001-855-817-7630 (Mexico), or 1-888-349-0106 (United States) or 1-412-902-0131 (International). All callers should dial in a minimum of 15 minutes prior to the start time and ask for the Mexichem conference call.
The call will also be available through an audio only live webcast until July 27, 2017. A replay of the call will be available approximately two hours after the end of the call. The replay can be accessed via Mexichem’s website at www.mexichem.com.
RECONCILIATION SUMMARY BY BUSINESS GROUP
First Quarter 2017 Financial and Operating Highlights
| Revenues | EBITDA | EBITDA Margin | ||||||||||||||||
| In million dollars | 1Q16 | 1Q17 | %Var. | 1Q16 | 1Q17 | %Var. | 1Q16 | 1Q17 | bps | |||||||||
| Vinyl | 499 | 599 | 20% | 79 | 88 | 12% | 15.8% | 14.7% | - 112 | |||||||||
| Fluent | 662 | 703 | 6% | 83 | 79 | -6% | 12.6% | 11.2% | - 140 | |||||||||
| Fluor | 139 | 138 | -1% | 49 | 51 | 4% | 34.8% | 36.6% | 173 | |||||||||
| Energy | 0 | 0 | 0 | 0 | ||||||||||||||
| Eliminations / Holding | -43 | -46 | 7% | -10 | -11 | 14% | ||||||||||||
| Mexichem Consolidated | 1,258 | 1,395 | 11% | 202 | 207 | 3% | 16.0% | 14.8% | - 121 | |||||||||
| 1Q16 | In million dollars | 1Q17 | Sub17 | Sub17/1Q16 | ||||||
| Revenues | Revenues | FX | Total | % Var Comp | ||||||
| 499 | Vinyl | 599 | 9 | 608 | 22% | |||||
| 662 | Fluent | 703 | 11 | 713 | 8% | |||||
| 1,161 | Ethylene (Vinyl + Fluent) | 1,302 | 20 | 1,321 | 14% | |||||
| 139 | Fluor | 138 | 4 | 143 | 2% | |||||
| 0 | Energy | 0 | 0 | 0 | ||||||
| -43 | Eliminations/ Holding | -46 | 0 | -46 | 7% | |||||
| 1,258 | Total | 1,395 | 24 | 1,419 | 13% | |||||
| 1Q16 | In million dollars | 1Q17 | Sub17 | Sub17/1Q16 | ||||||
| EBITDA | EBITDA | FX | Total | % Var Comp | ||||||
| 79 | Vinyl | 88 | 1 | 89 | 13% | |||||
| 83 | Fluent | 79 | 2 | 81 | -3% | |||||
| 162 | Ethylene (Vinyl + Fluent) | 167 | 4 | 170 | 5% | |||||
| 49 | Fluor | 51 | 1 | 51 | 5% | |||||
| 0 | Energy | 0 | 0 | 0 | ||||||
| -10 | Eliminations/ Holding | -11 | 0 | -11 | 14% | |||||
| 202 | Total | 207 | 4 | 211 | 5% |
Sub=Subtotal
ABOUT MEXICHEM
Mexichem is a global leader in plastic piping and one of the world’s largest chemical and petrochemical companies. It has more than 50 years of experience. The Company contributes to global development by delivering an extended portfolio of products to high growth sectors such as infrastructure, housing, datacom and water management, among others. With operations in 37 countries, 120 facilities worldwide and more than 18,000 employees, Mexichem has the rights to produce fluorspar in two mines in Mexico, as well as 8 formation academies and 15 R&D lab. Operations are divided into two value chains and three business units: Ethylene Chain: Vinyl and Fluent Business and Fluor Value Chain, which includes Fluor business group. Mexichem has annual revenues of US$5.4 billion and has been traded on the Mexican Stock Exchange for more than 30 years. The company is member of the Mexican Stock Exchange Sustainability Index and the sustainability emerging markets index FTSE4Good.
Forward-looking Statements
In addition to historical information, this press release contains "forward-looking" statements that reflect management's expectations for the future. The words “anticipate,” “believe,” “expect,” “hope,” “have the intention of,” “might,” “plan,” “should” and similar expressions generally indicate comments on expectations. The final results may be materially different from current expectations due to several factors, which include, but are not limited to, global and local changes in politics, the economy, business, competition, market and regulatory factors, cyclical trends in relevant sectors; as well as other factors that are highlighted under the title “Risk Factors” on the annual report submitted by Mexichem to the Mexican National Banking and Securities Commission (CNBV). The forward-looking statements included herein represent Mexichem’s views as of the date of this press release. Mexichem undertakes no obligation to revise or update publicly any forward-looking statement for any reason unless required by law.”
Mexichem has implemented a Code of Ethics that rules its relationships with its employees, clients, suppliers and general groups. Mexichem’s Code of Ethics is available for consulting in the following link: http://www.mexichem.com/Codigo_de_etica.htmlAdditionally, according to the terms contained in the Securities Exchange Act No 42, Mexichem Audit Committee established a mechanism of contact, which allows that any person that knows the unfulfilment of operational and accounting records guidelines and lack of internal controls of the Code of Ethics, from the Company itself or from the subsidiaries that this controls, file a complaint which is anonymously guaranteed. The whistleblower program is facilitated by a third party. The telephone number in Mexico is 01-800-062-12-03. The website is http://www.ethic-line.com/mexichem and contact e-mail is mexichem@ethic-line.com. Mexichem’s Audit Committee will be notified of all complaints for immediate investigation.
INDEPENDENT ANALYSTS
Currently, the following investment firms have analysts who cover Mexichem:
| 1. | -Actinver | |
| 2. | -Bank of America Merrill Lynch | |
| 3. | -Banorte-Ixe | |
| 4. | -Barclays | |
| 5. | -BBVA Bancomer | |
| 6. | -BTG Pactual | |
| 7. | -Citigroup | |
| 8. | -Credit Suisse | |
| 9. | -GBM-Grupo Bursátil Mexicano | |
| 10. | -Grupo Santander | |
| 11. | -HSBC | |
| 12. | -Intercam | |
| 13. | -Invex Casa de Bolsa | |
| 14. | -Interacciones | |
| 15. | -ITAU BBA | |
| 16. | -JP Morgan | |
| 17. | -Morgan Stanley | |
| 18. | -Monex | |
| 19. | -UBS | |
| 20. | -Vector | |
INTERNAL CONTROL
Mexichem’s bylaws provide the existence of the Audit and Corporate Practices Committees, intermediate corporate organs constituted in agreement with the applicable law to assist the Board of Directors to carry on their functions. Through these committees and the external auditor it is given reasonable safety that transactions and company’s acts are executed and registered in accordance with the terms and parameters set by the Board and directives of Mexichem, the applicable law and different general guidelines, criterion and IFRS (International Financial Reporting Standards).
APPENDIX I: CONSOLIDATED RESTRUCTURED FIGURES OF QUARTERLY RESULTS AS A CONSEQUENCE OF FLUENT BUSINESS GROUPS DISCONTINUED OPERATIONS, FREIGHT RECLASSIFICATIONS AND FIXED ASSET ACCOUNTING POLICY CHANGES
CHANGES 1Q16
| USD in thousands | Changes reported in 1Q16 | |||||||||
| INCOME STATEMENT | 1Q16 | Disc.operations and | Fixed assets | Disc.operations, | 1Q16 | |||||
| Net sales | 1,262,383 | (4,060) | - | (4,060) | 1,258,323 | |||||
| Cost of sales | 903,023 | 66,700 | (8,368) | 58,332 | 961,355 | |||||
| Gross Profit | 359,360 | (70,760) | 8,368 | (62,392) | 296,968 | |||||
| Operating expenses | 250,088 | (72,396) | (2,646) | (75,042) | 175,046 | |||||
| Operating Income | 109,272 | 1,636 | 11,014 | 12,650 | 121,922 | |||||
| Financial cost | 43,411 | - | - | - | 43,411 | |||||
| Equity income of associated entities | (927) | - | - | - | (927) | |||||
| Income from continued operations before income tax | 66,788 | 1,636 | 11,014 | 12,650 | 79,438 | |||||
| Cash tax | 39,951 | - | - | - | 39,951 | |||||
| Deferred tax | (22,563) | 655 | 3,533 | 4,188 | (18,375) | |||||
| Income Tax | 17,388 | 655 | 3,533 | 4,188 | 21,576 | |||||
| Income from continued operations | 49,400 | 981 | 7,481 | 8,462 | 57,862 | |||||
| Discontinued Operations | 583 | (981) | (981) | (398) | ||||||
| Net Consolidated Income | 49,983 | - | 7,481 | 7,481 | 57,464 | |||||
| Minority Interest | (610) | - | 331 | 331 | (279) | |||||
| Net Majority Income | 50,593 | - | 7,150 | 7,150 | 57,743 | |||||
| EBITDA | 200,418 | 1,397 | - | 1,397 | 201,815 | |||||
CHANGES 2Q16
| USD in thousands | Changes reported in 2Q16 | |||||||||
| INCOME STATEMENT | 2Q16 | Disc.operations and | Fixed assets | Disc.operations, | 2Q16 | |||||
| Net sales | 1,427,005 | (6,992) | - | (6,992) | 1,420,013 | |||||
| Cost of sales | 998,400 | 69,580 | (8,411) | 61,169 | 1,059,569 | |||||
| Gross Profit | 428,605 | (76,572) | 8,411 | (68,161) | 360,444 | |||||
| Operating expenses | 549,336 | (79,390) | (416) | (79,806) | 469,530 | |||||
| Operating Income | (120,731) | 2,818 | 8,827 | 11,645 | (109,086) | |||||
| Financial cost | 41,516 | - | - | - | 41,516 | |||||
| Equity income of associated entities | (2,688) | - | - | - | (2,688) | |||||
| Income from continued operations before income tax | (159,559) | 2,818 | 8,827 | 11,645 | (147,914) | |||||
| Cash tax | 51,860 | - | - | - | 51,860 | |||||
| Deferred tax | (81,953) | 1,127 | 2,939 | 4,066 | (77,887) | |||||
| Income Tax | (30,093) | 1,127 | 2,939 | 4,066 | (26,027) | |||||
| Income from continued operations | (129,466) | 1,691 | 5,888 | 7,579 | (121,887) | |||||
| Discontinued Operations | 599 | (1,691) | (1,691) | (1,092) | ||||||
| Net Consolidated Income | (128,867) | - | 5,888 | 5,888 | (122,979) | |||||
| Minority Interest | (96,067) | - | 317 | 317 | (95,750) | |||||
| Net Majority Income | (32,800) | - | 5,571 | 5,571 | (27,229) | |||||
| EBITDA | (29,401) | 2,407 | - | 2,407 | (26,994) | |||||
CHANGES 3Q16
| USD in thousands | Changes reported in 3Q16 | |||||||||
| INCOME STATEMENT | 3Q16 | Disc.operations and | Fixed assets | Disc.operations, | 3Q16 | |||||
| Net sales | 1,400,267 | (6,766) | - | (6,766) | 1,393,501 | |||||
| Cost of sales | 1,011,919 | 69,019 | (8,196) | 60,823 | 1,072,742 | |||||
| Gross Profit | 388,348 | (75,785) | 8,196 | (67,589) | 320,759 | |||||
| Operating expenses | 14,228 | (78,513) | (399) | (78,912) | (64,684) | |||||
| Operating Income | 374,120 | 2,728 | 8,595 | 11,323 | 385,443 | |||||
| Financial cost | 50,491 | - | - | - | 50,491 | |||||
| Equity income of associated entities | 131 | - | - | - | 131 | |||||
| Income from continued operations before income tax | 323,498 | 2,728 | 8,595 | 11,323 | 334,821 | |||||
| Cash tax | 35,906 | - | - | - | 35,906 | |||||
| Deferred tax | 57,179 | 1,091 | 2,878 | 3,969 | 61,148 | |||||
| Income Tax | 93,085 | 1,091 | 2,878 | 3,969 | 97,054 | |||||
| Income from continued operations | 230,413 | 1,637 | 5,717 | 7,354 | 237,767 | |||||
| Discontinued Operations | (6,573) | (1,637) | (1,637) | (8,210) | ||||||
| Net Consolidated Income | 223,840 | - | 5,717 | 5,717 | 229,557 | |||||
| Minority Interest | 68,552 | - | 316 | 316 | 68,868 | |||||
| Net Majority Income | 155,288 | - | 5,401 | 5,401 | 160,689 | |||||
| EBITDA | 465,881 | 2,329 | - | 2,329 | 468,210 | |||||
CHANGES 4Q16
| USD in thousands | Changes reported in 4Q16 | |||||||||
| INCOME STATEMENT | 4Q16 | Disc.operations and | Fixed assets | Disc.operations, | 4Q16 | |||||
| Net sales | 1,260,152 | 17,818 | - | 17,818 | 1,277,970 | |||||
| Cost of sales | 1,230,131 | (205,299) | (9,530) | (214,829) | 1,015,302 | |||||
| Gross Profit | 30,021 | 223,117 | 9,530 | 232,647 | 262,668 | |||||
| Operating expenses | (121,557) | 230,299 | (723) | 229,576 | 108,019 | |||||
| Operating Income | 151,578 | (7,182) | 10,253 | 3,071 | 154,649 | |||||
| Financial cost | 27,513 | - | - | - | 27,513 | |||||
| Equity income of associated entities | 611 | - | - | - | 611 | |||||
| Income from continued operations before income tax | 123,454 | (7,182) | 10,253 | 3,071 | 126,525 | |||||
| Cash tax | 61,578 | - | - | - | 61,578 | |||||
| Deferred tax | (20,037) | (2,873) | 3,485 | 612 | (19,425) | |||||
| Income Tax | 41,541 | (2,873) | 3,485 | 612 | 42,153 | |||||
| Income from continued operations | 81,913 | (4,309) | 6,768 | 2,459 | 84,372 | |||||
| Discontinued Operations | (5,389) | 4,309 | 4,309 | (1,080) | ||||||
| Net Consolidated Income | 76,524 | - | 6,768 | 6,768 | 83,292 | |||||
| Minority Interest | 11,206 | - | 283 | 283 | 11,489 | |||||
| Net Majority Income | 65,318 | - | 6,485 | 6,485 | 71,803 | |||||
| EBITDA | 246,856 | - | - | - | 246,856 | |||||
CHANGES FY16
| USD in thousands | Changes reported in 2016 | |||||||||
| INCOME STATEMENT | 2016 | Disc.operations and | Fixed assets | Disc.operations, | 2016 | |||||
| Net sales | 5,349,807 | - | - | - | 5,349,807 | |||||
| Cost of sales | 4,143,473 | - | (34,505) | (34,505) | 4,108,968 | |||||
| Gross Profit | 1,206,334 | - | 34,505 | 34,505 | 1,240,839 | |||||
| Operating expenses | 692,095 | - | (4,184) | (4,184) | 687,911 | |||||
| Operating Income | 514,239 | - | 38,689 | 38,689 | 552,928 | |||||
| Financial cost | 162,931 | - | - | - | 162,931 | |||||
| Equity income of associated entities | (2,873) | - | - | - | (2,873) | |||||
| Income from continued operations before income tax | 354,181 | - | 38,689 | 38,689 | 392,870 | |||||
| Cash tax | 189,295 | - | - | - | 189,295 | |||||
| Deferred tax | (67,374) | - | 12,835 | 12,835 | (54,539) | |||||
| Income Tax | 121,921 | - | 12,835 | 12,835 | 134,756 | |||||
| Income from continued operations | 232,260 | - | 25,855 | 25,855 | 258,115 | |||||
| Discontinued Operations | (10,780) | - | - | - | (10,780) | |||||
| Net Consolidated Income | 221,480 | - | 25,855 | 25,855 | 247,335 | |||||
| Minority Interest | (16,919) | - | 1,247 | 1,247 | (15,672) | |||||
| Net Majority Income | 238,399 | - | 24,608 | 24,608 | 263,007 | |||||
| EBITDA | 883,754 | - | - | - | 883,754 | |||||
APPENDIX II: CONSOLIDATED RESTRUCTURED FIGURES OF BALANCE SHEET BY QUARTER AS A CONSEQUENCE OF FIXED ASSET ACCOUNTING POLICY CHANGES
| USD in thousands | Consolidated | Adjustments | Consolidated | Consolidated | Adjustments | Consolidated | Consolidated | Adjustments | Consolidated | Consolidated | Adjustments | Consolidated | Consolidated | Adjustments | Consolidated | |||||||||||||||
| Current Assets | ||||||||||||||||||||||||||||||
| Cash and Cash equivalents | 653,274 | - | 653,274 | 586,462 | - | 586,462 | 661,521 | - | 661,521 | 651,027 | - | 651,027 | 713,607 | - | 713,607 | |||||||||||||||
| Net Account Receivable | 884,344 | - | 884,344 | 975,123 | - | 975,123 | 988,399 | - | 988,399 | 1,276,846 | - | 1,276,846 | 1,180,581 | - | 1,180,581 | |||||||||||||||
| Other current assets | 697,730 | - | 697,730 | 716,801 | - | 716,801 | 701,201 | - | 701,201 | 704,147 | - | 704,147 | 644,965 | - | 644,965 | |||||||||||||||
| Assets held for sale | 16,505 | - | 16,505 | 15,796 | - | 15,796 | 15,492 | - | 15,492 | 15,274 | - | 15,274 | 21,050 | - | 21,050 | |||||||||||||||
| Total Current Assets | 2,251,853 | - | 2,251,853 | 2,294,182 | - | 2,294,182 | 2,366,613 | - | 2,366,613 | 2,647,294 | - | 2,647,294 | 2,560,203 | - | 2,560,203 | |||||||||||||||
| Property, plant and equipment | 4,202,927 | (470,395) | 3,732,532 | 4,304,729 | (462,139) | 3,842,590 | 4,167,209 | (455,927) | 3,711,282 | 4,212,701 | (449,936) | 3,762,765 | 4,201,580 | (451,987) | 3,749,593 | |||||||||||||||
| Net other assets | 2,214,896 | - | 2,214,896 | 2,241,552 | - | 2,241,552 | 2,228,212 | - | 2,228,212 | 2,221,775 | - | 2,221,775 | 2,044,219 | - | 2,044,219 | |||||||||||||||
| Total Assets | 8,669,676 | (470,395) | 8,199,281 | 8,840,463 | (462,139) | 8,378,324 | 8,762,034 | (455,927) | 8,306,107 | 9,081,770 | (449,936) | 8,631,834 | 8,806,002 | (451,987) | 8,354,015 | |||||||||||||||
| Current Liabilities | ||||||||||||||||||||||||||||||
| Bank loans and current portion of long-term debt | 43,653 | - | 43,653 | 61,405 | - | 61,405 | 62,453 | - | 62,453 | 64,328 | - | 64,328 | 57,693 | - | 57,693 | |||||||||||||||
| Suppliers and letters of credit of suppliers | 1,201,021 | - | 1,201,021 | 1,239,836 | - | 1,239,836 | 1,244,376 | - | 1,244,376 | 1,292,090 | - | 1,292,090 | 1,269,704 | - | 1,269,704 | |||||||||||||||
| Other current liabilities | 554,270 | - | 554,270 | 512,300 | - | 512,300 | 603,755 | - | 603,755 | 558,411 | - | 558,411 | 644,393 | - | 644,393 | |||||||||||||||
| Liabilities associated with asset held for sale | 19,617 | - | 19,617 | 16,390 | - | 16,390 | 15,242 | - | 15,242 | 17,603 | - | 17,603 | 13,207 | - | 13,207 | |||||||||||||||
| Total Current Liabilities | 1,818,561 | - | 1,818,561 | 1,829,931 | - | 1,829,931 | 1,925,826 | - | 1,925,826 | 1,932,432 | - | 1,932,432 | 1,984,997 | - | 1,984,997 | |||||||||||||||
| Bank loans and long-term debt | 2,291,422 | - | 2,291,422 | 2,280,001 | - | 2,280,001 | 2,263,519 | - | 2,263,519 | 2,249,154 | - | 2,249,154 | 2,241,370 | - | 2,241,370 | |||||||||||||||
| Long-term other liabilities | 880,912 | (141,577) | 739,335 | 931,017 | (138,044) | 792,973 | 815,178 | (135,105) | 680,073 | 888,524 | (132,242) | 756,282 | 682,081 | (136,039) | 546,042 | |||||||||||||||
| Total Liabilities | 4,990,895 | (141,577) | 4,849,318 | 5,040,949 | (138,044) | 4,902,905 | 5,004,523 | (135,105) | 4,869,418 | 5,070,110 | (132,242) | 4,937,868 | 4,908,448 | (136,039) | 4,772,409 | |||||||||||||||
| Capital stock | 1,755,257 | - | 1,755,257 | 1,755,257 | - | 1,755,257 | 1,755,257 | - | 1,755,257 | 1,755,257 | - | 1,755,257 | 1,755,257 | - | 1,755,257 | |||||||||||||||
| Retained earnings | 1,007,055 | 256,296 | 1,263,351 | 1,073,900 | 263,446 | 1,337,346 | 1,035,661 | 269,017 | 1,304,678 | 1,191,828 | 274,418 | 1,466,246 | 1,126,021 | 280,904 | 1,406,925 | |||||||||||||||
| Other comprehensive income | 140,050 | (569,232) | (429,182) | 154,015 | (571,990) | (417,975) | 191,530 | (574,605) | (383,075) | 175,756 | (577,194) | (401,438) | 97,829 | (582,217) | (484,388) | |||||||||||||||
| Controlling interest | 2,902,362 | (312,936) | 2,589,426 | 2,983,172 | (308,544) | 2,674,628 | 2,982,448 | (305,588) | 2,676,860 | 3,122,841 | (302,776) | 2,820,065 | 2,979,107 | (301,313) | 2,677,794 | |||||||||||||||
| Non-controlling interest | 776,419 | (15,882) | 760,537 | 816,343 | (15,551) | 800,792 | 775,063 | (15,234) | 759,829 | 888,819 | (14,918) | 873,901 | 918,447 | (14,635) | 903,812 | |||||||||||||||
| Total stockholders’ equity | 3,678,781 | (328,818) | 3,349,963 | 3,799,515 | (324,095) | 3,475,420 | 3,757,511 | (320,822) | 3,436,689 | 4,011,660 | (317,694) | 3,693,966 | 3,897,554 | (315,948) | 3,581,606 | |||||||||||||||
View source version on businesswire.com: http://www.businesswire.com/news/home/20170426006849/en/
Contacts:
Investor Relations:
Marcela
Muñoz Moheno, + (52) 55-5366-4000 x 4206
marcela.munoz@mexichem.com
www.mexichem.com
