Here we are again! Back in January, the S&P 500 staged an epic rally that took us over the 2,700 line to 2,850 before falling back to 2,700 in early February, when I wrote " 10% Tuesday – Market Correction Hits Our Primary Goal " and " Flailing Thursday – Trouble at 2,700 " saying: Well, it's been a day and people are already freaking out because we haven't flown back to 2,850 and it's going to be a while before they realize 2,850 shouldn't have happened in the first place and it's more likely that this (2,700) is the top of the range, not the bottom – at least through Q2. On our Big Chart, 2,640 is the 20% line on the S&P and, even being generous, THAT should be the middle of a range we move 5% up (2,772) and 5% down (2,508) in, so call it 2,500 to 2,800 with 2,650 the middle line. That's where I think we'll settle once all the dust clears. As you can see, from the S&P chart using our predicted lines and the Fibonacci series above and below them – everything is proceeding as I have forseen for the past 3 months and now we get to see if earnings season can keep us in the green end of our trading range or not. IN PROGRESS
 Here we are again!
Back in January, the S&P 500 staged an epic rally that took us over the 2,700 line to 2,850 before falling back to 2,700 in early February, when I wrote "10% Tuesday – Market Correction Hits Our Primary Goal" and "Flailing Thursday – Trouble at 2,700" saying:
Well, it's been a day and people are already freaking out because we haven't flown back to 2,850 and it's going to be a while before they realize 2,850 shouldn't have happened in the first place and it's more likely that this (2,700) is the top of the range, not the bottom – at least through Q2. On our Big Chart, 2,640 is the 20% line on the S&P and, even being generous, THAT should be the middle of a range we move 5% up (2,772) and 5% down (2,508) in, so call it 2,500 to 2,800 with 2,650 the middle line. That's where I think we'll settle once all the dust clears.
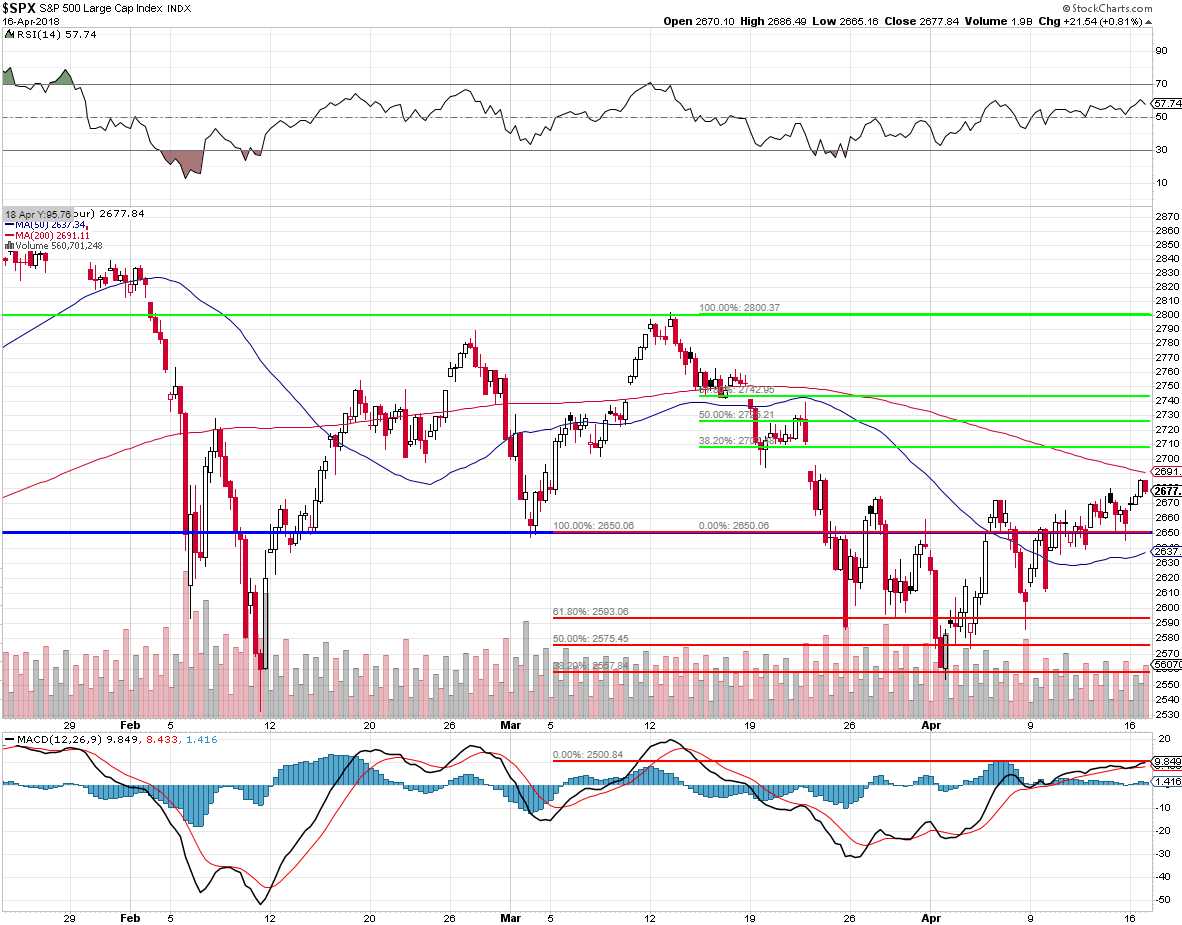
As you can see, from the S&P chart using our predicted lines and the Fibonacci series above and below them – everything is proceeding as I have forseen for the past 3 months and now we get to see if earnings season can keep us in the green end of our trading range or not.
IN PROGRESS

