


Drew Angerer/Getty Images
- The US initial-public-offering market was extremely busy during the first 10 months of the year, but slowed down in November due to market volatility.
- The IPO activity was led by healthcare and tech companies.
- Because of the market weakness at the end of the year, the average performance of this year's IPOs has been poor.
The US initial-public-offering market had a busy start to 2018, but slowed down in November as a massive stock-market sell-off and spike in volatility caused IPO candidates to postpone deals.
A total of 191 companies went public in 2018, raising $46.8 billion. That's up from last year's 160 IPOs and $35.5 billion of proceeds. IPO activities rose 42% year-over-year during the first 10 months of the year, however, that number fell by 66% versus a year ago over the final two months, according to data tracked by Renaissance Capital.
"The market volatility and market sell-off had a direct impact on the IPO market," said Matthew Kennedy, IPO market strategist at Renaissance. "It's extremely difficult to price IPOs when markets are this volatile. Companies will just wait until next year."
Breaking down the sectors, IPO activity was led by the healthcare sector, with 76 companies raising $9.1 billion. That was followed by tech, which saw 52 offerings raise $18.4 billion.
"Market conditions heading into 2018 were good for biotechs," Kennedy said, adding that pre-IPO funding rounds dating back to 2015 helped many biotech companies get ready to go public — especially in late 2017 when IPO investors made very strong gains in the pharma space.
The number of US domestic tech IPOs decreased. But that was more than offset by Chinese tech companies going to market. They accounted for four of the 10 largest IPOs in the US this year.
"If the strong market conditions in 2017 drove biotech issuers, weak market conditions in China drove Chinese companies to seek out the stable markets in the United States," Kennedy said. China's benchmark Shanghai Stock Exchange Composite Index was down more than 23.9% this year through Thursday.
So far, the average performance of this year's IPOs has been poor due to the stock market sell-off that began in late September/early October, according to Kennedy. Shares of companies that went public this year had averaged a 5% gain through December 13, well below the five-year average of 20%, Renaissance data show.
Here's a snapshot of how the 23 largest domestic IPOs - all worth at least $500 million - have performed this year through Thursday, in ascending order of their size.
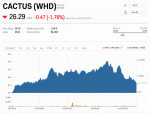
CactusMITicker: WHD
Sector: Industrial
IPO size: $502.55 million
IPO price: $19
IPO-to-date performance: +38%
Source: Bloomberg data
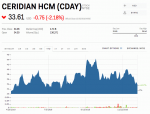
Ceridian HCM HoldingMI
Ticker: CDAY
Sector: Technology
IPO size: $531.3 million
IPO price: $22
IPO-to-date performance: +53%
Source: Bloomberg data
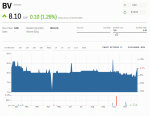
BrightView HoldingsMI
Ticker: BV
Sector: Consumer
IPO size: $538.89 million
IPO price: $22
IPO-to-date performance: -63%
Source: Bloomberg data
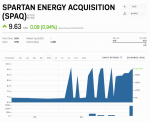
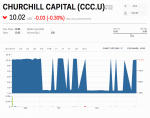
Spartan Energy AcquisitionMI
Ticker: SPAQ
Sector: Diversified
IPO size: $552 million
IPO price: $10
IPO-to-date performance: -4%
Source: Bloomberg data
GrafTech InternationalMI
Ticker: EAF
Sector: Industrial
IPO size: $571.46 million
IPO price: $15
IPO-to-date performance: -24%
Source: Bloomberg data
See the rest of the story at Business Insider
See Also:
