


The AES Corporation (NYSE: AES) today reported financial results for the year ended December 31, 2018.
This press release features multimedia. View the full release here: https://www.businesswire.com/news/home/20190227005185/en/
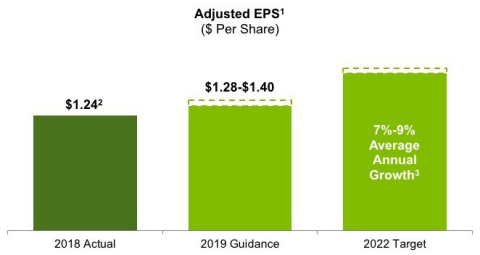
2019 Guidance and Expectations Through 2022 (Graphic: Business Wire)
"2018 was a very good year for AES, demonstrated by our strong financial results and excellent progress toward achieving our strategic goals, including enhancing the resilience of our portfolio and increasing the profitability of our business. We finished the year at the high end of our ranges for both Adjusted EPS and Parent Free Cash Flow, completed construction of 1.3 GW of new projects and grew our backlog to 5.8 GW," said Andrés Gluski, AES President and Chief Executive Officer. "We expect to generate $4 billion in discretionary cash through 2022, which we will allocate to deliver double-digit annual total returns to our shareholders."
"In 2018, we paid down $1 billion in Parent debt, including $150 million of accelerated repayments in the fourth quarter. As a result, we achieved a key investment grade financial metric of 3.95x Parent leverage, one year ahead of our plan, providing us more comfort in our ability to attain investment grade ratings in 2020," said Gustavo Pimenta, AES Executive Vice President and Chief Financial Officer. "Reflecting our progress on our strategic goals, and our increased confidence in our forecast, we are extending our longer-term outlook by two years, and now expect 7% to 9% average annual growth in Adjusted EPS and Parent Free Cash Flow through 2022."
Key Full Year 2018 Financial Results
Full year 2018 Diluted Earnings Per Share from Continuing Operations (Diluted EPS) was $1.48, an increase of $2.25 compared to full year 2017, reflecting 2018 gains on the sale of assets, primarily in the Philippines, and the impact of the one-time transition tax resulting from the enactment of the U.S. Tax Cuts and Jobs Act, primarily recorded in 2017.
Full year 2018 Adjusted Earnings Per Share (Adjusted EPS, a non-GAAP financial measure) increased $0.16 to $1.24, primarily driven by higher margins, particularly at the Company's US and Utilities and South America Strategic Business Units (SBUs), and lower Parent Company interest expense. These impacts were partially offset by asset sales in the Philippines and Kazakhstan.
Detailed Strategic Highlights
-
In 2018, the Company paid down $1 billion in Parent debt, including
$150 million in the fourth quarter of 2018
- Reduced Parent debt by 21%, to $3,686 million, compared to December 31, 2017
- In December 2018, the Company achieved a key investment grade financial metric of 3.95x Parent leverage one year earlier than previously planned
-
As of December 31, 2018, the Company's backlog of 5,787 MW includes:
- 3,841 MW under construction and coming on-line through 2021; and
-
1,946 MW of renewables signed under long-term PPAs, including 125
MW in the fourth quarter of 2018:
- 80 MW Vientos Nequinos wind project with commercial and industrial customers in Argentina
- 25 MW of solar capacity at AES Distributed Energy (AES DE) with commercial and industrial customers in the U.S.
- 20 MW Castilla solar project with Ecopetrol in Colombia
-
In 2018, the Company agreed to sell approximately 48% of its interest
in sPower's operating portfolio
- In October 2018, the Company signed the first agreement to sell approximately 24% to a subsidiary of Ullico Inc.
- In December 2018, the Company signed a second agreement to sell approximately 24% to a private markets infrastructure manager
- These transactions, once closed, combined with other steps the Company has taken, including two completed refinancings and a reduction in operating costs, will increase the Company's return on sPower's operating portfolio to 13%
- Once these sales close, AES' ownership in sPower's operating portfolio will decrease from 50% to approximately 26%
- In 2018, the Company signed long-term agreements to sell 25 TBTU of LNG annually in the Dominican Republic, which will contribute to growth beyond 2020
Guidance and Expectations1
The Company is initiating 2019 guidance for Adjusted EPS of $1.28 to $1.40, compared to 2018 Adjusted EPS of $1.24. The Company also expects 2019 Parent Free Cash Flow of $700 to $750 million, compared to 2018 Parent Free Cash Flow of $689 million. The Company is also setting an annual growth rate target of 7% to 9% through 2022 for both Adjusted EPS and Parent Free Cash Flow, from a 2018 base.
| 1 | Adjusted EPS and Parent Free Cash Flow are non-GAAP financial measures. See attached "Non-GAAP Measures" for definition of Adjusted EPS and see below for definition of Parent Free Cash Flow. The Company is not able to provide a corresponding GAAP equivalent reconciliation for its Adjusted EPS guidance without unreasonable effort. See "Non-GAAP measures" for description of the adjustments to reconcile Adjusted EPS to Diluted EPS. | |
| 2 | 2018 Adjusted EPS guidance was $1.15 to $1.25 and 2018 Parent Free Cash Flow expectation was $600 million to $675 million. | |
| 3 | From a base of 2018 Adjusted EPS of $1.24 and 2018 Parent Free Cash Flow of $689 million. | |
The Company's 2019 guidance, expectations and growth rate target through 2022 are based on foreign currency and commodity forward curves as of December 31, 2018.
Non-GAAP Financial Measures
See Non-GAAP Financial Measures for definitions of Adjusted Earnings Per Share and Adjusted Pre-Tax Contributions, as well as reconciliations to the most comparable GAAP financial measures. Parent Free Cash Flow should not be construed as an alternative to Net Cash Provided by Operating Activities which is determined in accordance with GAAP.
Parent Free Cash Flow is equal to Subsidiary Distributions less cash used for interest costs, development, general and administrative activities, and tax payments by the Parent Company. Parent Free Cash Flow is used for dividends, share repurchases, growth investments, recourse debt repayments, and other uses by the Parent Company.
Attachments
Condensed Consolidated Statements of Operations, Segment Information, Condensed Consolidated Balance Sheets, Condensed Consolidated Statements of Cash Flows, Non-GAAP Financial Measures and Parent Financial Information.
Conference Call Information
AES will host a conference call on Wednesday, February 27, 2019 at 9:00 a.m. Eastern Standard Time (EST). Interested parties may listen to the teleconference by dialing 1-888-317-6003 at least ten minutes before the start of the call. International callers should dial +1-412-317-6061. The Conference ID for this call is 2385618. Internet access to the conference call and presentation materials will be available on the AES website at www.aes.com by selecting “Investors” and then “Presentations and Webcasts.”
A webcast replay, as well as a replay in downloadable MP3 format, will be accessible at www.aes.com beginning shortly after the completion of the call.
About AES
The AES Corporation (NYSE: AES) is a Fortune 500 global power company. We provide affordable, sustainable energy to 15 countries through our diverse portfolio of distribution businesses as well as thermal and renewable generation facilities. Our workforce is committed to operational excellence and meeting the world’s changing power needs. Our 2018 revenues were $11 billion and we own and manage $33 billion in total assets. To learn more, please visit www.aes.com. Follow AES on Twitter @TheAESCorp.
Safe Harbor Disclosure
This news release contains forward-looking statements within the meaning of the Securities Act of 1933 and of the Securities Exchange Act of 1934. Such forward-looking statements include, but are not limited to, those related to future earnings, growth and financial and operating performance. Forward-looking statements are not intended to be a guarantee of future results, but instead constitute AES’ current expectations based on reasonable assumptions. Forecasted financial information is based on certain material assumptions. These assumptions include, but are not limited to, our accurate projections of future interest rates, commodity price and foreign currency pricing, continued normal levels of operating performance and electricity volume at our distribution companies and operational performance at our generation businesses consistent with historical levels, as well as the execution of PPAs, conversion of our backlog and growth investments at normalized investment levels and rates of return consistent with prior experience.
Actual results could differ materially from those projected in our forward-looking statements due to risks, uncertainties and other factors. Important factors that could affect actual results are discussed in AES’ filings with the Securities and Exchange Commission (the “SEC”), including, but not limited to, the risks discussed under Item 1A: “Risk Factors” and Item 7: Management’s Discussion & Analysis in AES’ 2018 Annual Report on Form 10-K and in subsequent reports filed with the SEC. Readers are encouraged to read AES’ filings to learn more about the risk factors associated with AES’ business. AES undertakes no obligation to update or revise any forward-looking statements, whether as a result of new information, future events or otherwise.
Any Stockholder who desires a copy of the Company’s 2018 Annual Report on Form 10-K dated on or about February 27, 2019 with the SEC may obtain a copy (excluding Exhibits) without charge by addressing a request to the Office of the Corporate Secretary, The AES Corporation, 4300 Wilson Boulevard, Arlington, Virginia 22203. Exhibits also may be requested, but a charge equal to the reproduction cost thereof will be made. A copy of the Form 10-K may be obtained by visiting the Company’s website at www.aes.com.
| THE AES CORPORATION | ||||||||||||
| Consolidated Statements of Operations | ||||||||||||
| Year Ended December 31, | ||||||||||||
| 2018 | 2017 | 2016 | ||||||||||
| (in millions, except per share amounts) | ||||||||||||
| Revenue: | ||||||||||||
| Regulated | $ | 2,939 | $ | 3,109 | $ | 3,310 | ||||||
| Non-Regulated | 7,797 | 7,421 | 6,971 | |||||||||
| Total revenue | 10,736 | 10,530 | 10,281 | |||||||||
| Cost of Sales: | ||||||||||||
| Regulated | (2,473 | ) | (2,650 | ) | (2,839 | ) | ||||||
| Non-Regulated | (5,690 | ) | (5,415 | ) | (5,059 | ) | ||||||
| Total cost of sales | (8,163 | ) | (8,065 | ) | (7,898 | ) | ||||||
| Operating margin | 2,573 | 2,465 | 2,383 | |||||||||
| General and administrative expenses | (192 | ) | (215 | ) | (194 | ) | ||||||
| Interest expense | (1,056 | ) | (1,170 | ) | (1,134 | ) | ||||||
| Interest income | 310 | 244 | 245 | |||||||||
| Loss on extinguishment of debt | (188 | ) | (68 | ) | (13 | ) | ||||||
| Other expense | (58 | ) | (58 | ) | (80 | ) | ||||||
| Other income | 72 | 120 | 64 | |||||||||
| Gain (loss) on disposal and sale of business interests | 984 | (52 | ) | 29 | ||||||||
| Asset impairment expense | (208 | ) | (537 | ) | (1,096 | ) | ||||||
| Foreign currency transaction gains (losses) | (72 | ) | 42 | (15 | ) | |||||||
| Other non-operating expense | (147 | ) | — | (2 | ) | |||||||
| INCOME FROM CONTINUING OPERATIONS BEFORE TAXES AND EQUITY IN EARNINGS OF AFFILIATES | 2,018 | 771 | 187 | |||||||||
| Income tax expense | (708 | ) | (990 | ) | (32 | ) | ||||||
| Net equity in earnings of affiliates | 39 | 71 | 36 | |||||||||
| INCOME (LOSS) FROM CONTINUING OPERATIONS | 1,349 | (148 | ) | 191 | ||||||||
| Income (loss) from operations of discontinued businesses, net of income tax benefit (expense) of $(2), $(21), and $229, respectively | (9 | ) | (18 | ) | 151 | |||||||
| Gain (loss) from disposal and impairments of discontinued businesses, net of income tax benefit (expense) of $(44), $0, and $266, respectively | 225 | (611 | ) | (1,119 | ) | |||||||
| NET INCOME (LOSS) | 1,565 | (777 | ) | (777 | ) | |||||||
| Noncontrolling interests: | ||||||||||||
| Less: Income from continuing operations attributable to noncontrolling interests and redeemable stock of subsidiaries | (364 | ) | (359 | ) | (211 | ) | ||||||
| Less: Loss (income) from discontinued operations attributable to noncontrolling interests | 2 | (25 | ) | (142 | ) | |||||||
| NET INCOME (LOSS) ATTRIBUTABLE TO THE AES CORPORATION | $ | 1,203 | $ | (1,161 | ) | $ | (1,130 | ) | ||||
| AMOUNTS ATTRIBUTABLE TO THE AES CORPORATION COMMON STOCKHOLDERS: | ||||||||||||
| Income (loss) from continuing operations, net of tax | $ | 985 | $ | (507 | ) | $ | (20 | ) | ||||
| Income (loss) from discontinued operations, net of tax | 218 | (654 | ) | (1,110 | ) | |||||||
| NET INCOME (LOSS) ATTRIBUTABLE TO THE AES CORPORATION | $ | 1,203 | $ | (1,161 | ) | $ | (1,130 | ) | ||||
| BASIC EARNINGS PER SHARE: | ||||||||||||
| Income (loss) from continuing operations attributable to The AES Corporation common stockholders, net of tax | $ | 1.49 | $ | (0.77 | ) | $ | (0.04 | ) | ||||
| Income (loss) from discontinued operations attributable to The AES Corporation common stockholders, net of tax | 0.33 | (0.99 | ) | (1.68 | ) | |||||||
| NET INCOME (LOSS) ATTRIBUTABLE TO THE AES CORPORATION COMMON STOCKHOLDERS | $ | 1.82 | $ | (1.76 | ) | $ | (1.72 | ) | ||||
| DILUTED EARNINGS PER SHARE: | ||||||||||||
| Income (loss) from continuing operations attributable to The AES Corporation common stockholders, net of tax | $ | 1.48 | $ | (0.77 | ) | $ | (0.04 | ) | ||||
| Income (loss) from discontinued operations attributable to The AES Corporation common stockholders, net of tax | 0.33 | (0.99 | ) | (1.68 | ) | |||||||
| NET INCOME (LOSS) ATTRIBUTABLE TO THE AES CORPORATION COMMON STOCKHOLDERS | $ | 1.81 | $ | (1.76 | ) | $ | (1.72 | ) | ||||
| DIVIDENDS DECLARED PER COMMON SHARE | $ | 0.53 | $ | 0.49 | $ | 0.45 | ||||||
| THE AES CORPORATION | ||||||||
| Consolidated Statements of Operations (Unaudited) | ||||||||
| Three Months Ended December 31, | ||||||||
| 2018 | 2017 | |||||||
| (in millions, except per share amounts) | ||||||||
| Revenue: | ||||||||
| Regulated | $ | 724 | $ | 660 | ||||
| Non-Regulated | 1,898 | 1,983 | ||||||
| Total revenue | 2,622 | 2,643 | ||||||
| Cost of Sales: | ||||||||
| Regulated | (617 | ) | (562 | ) | ||||
| Non-Regulated | (1,359 | ) | (1,436 | ) | ||||
| Total cost of sales | (1,976 | ) | (1,998 | ) | ||||
| Operating margin | 646 | 645 | ||||||
| General and administrative expenses | (58 | ) | (60 | ) | ||||
| Interest expense | (257 | ) | (310 | ) | ||||
| Interest income | 79 | 59 | ||||||
| Loss on extinguishment of debt | (1 | ) | (24 | ) | ||||
| Other expense | (21 | ) | 9 | |||||
| Other income | 42 | 17 | ||||||
| Gain (loss) on disposal and sale of business interests | 128 | (3 | ) | |||||
| Asset impairment expense | (42 | ) | (277 | ) | ||||
| Foreign currency transaction gains (losses) | (28 | ) | 28 | |||||
| Other non-operating expense | (142 | ) | — | |||||
| INCOME FROM CONTINUING OPERATIONS BEFORE TAXES AND EQUITY IN EARNINGS OF AFFILIATES | 346 | 84 | ||||||
| Income tax expense | (199 | ) | (744 | ) | ||||
| Net equity in earnings of affiliates | 8 | 38 | ||||||
| INCOME (LOSS) FROM CONTINUING OPERATIONS | 155 | (622 | ) | |||||
| Loss from operations of discontinued businesses, net of income tax benefit of $0 and $3, respectively | — | (53 | ) | |||||
| Gain (loss) from disposal and impairments of discontinued businesses | 26 | (611 | ) | |||||
| NET INCOME (LOSS) | 181 | (1,286 | ) | |||||
| Noncontrolling interests: | ||||||||
| Less: Income from continuing operations attributable to noncontrolling interests and redeemable stock of subsidiaries | (53 | ) | (61 | ) | ||||
| Less: Loss from discontinued operations attributable to noncontrolling interests | — | 5 | ||||||
| NET INCOME (LOSS) ATTRIBUTABLE TO THE AES CORPORATION | $ | 128 | $ | (1,342 | ) | |||
| AMOUNTS ATTRIBUTABLE TO THE AES CORPORATION COMMON STOCKHOLDERS: | ||||||||
| Income (loss) from continuing operations, net of tax | $ | 102 | $ | (683 | ) | |||
| Income (loss) from discontinued operations, net of tax | 26 | (659 | ) | |||||
| NET INCOME (LOSS) ATTRIBUTABLE TO THE AES CORPORATION | $ | 128 | $ | (1,342 | ) | |||
| BASIC EARNINGS PER SHARE: | ||||||||
| Income (loss) from continuing operations attributable to The AES Corporation common stockholders, net of tax | $ | 0.15 | $ | (1.03 | ) | |||
| Income (loss) from discontinued operations attributable to The AES Corporation common stockholders, net of tax | 0.04 | (1.00 | ) | |||||
| NET INCOME (LOSS) ATTRIBUTABLE TO THE AES CORPORATION COMMON STOCKHOLDERS | $ | 0.19 | $ | (2.03 | ) | |||
| DILUTED EARNINGS PER SHARE: | ||||||||
| Income (loss) from continuing operations attributable to The AES Corporation common stockholders, net of tax | $ | 0.15 | $ | (1.03 | ) | |||
| Income (loss) from discontinued operations attributable to The AES Corporation common stockholders, net of tax | 0.04 | (1.00 | ) | |||||
| NET INCOME (LOSS) ATTRIBUTABLE TO THE AES CORPORATION COMMON STOCKHOLDERS | $ | 0.19 | $ | (2.03 | ) | |||
| DIVIDENDS DECLARED PER COMMON SHARE | $ | 0.27 | $ | 0.25 | ||||
| THE AES CORPORATION | |||||||||||||||
| Strategic Business Unit (SBU) Information | |||||||||||||||
| (Unaudited) | |||||||||||||||
Three Months Ended | Year Ended | ||||||||||||||
| (in millions) | 2018 | 2017 | 2018 | 2017 | |||||||||||
| REVENUE | |||||||||||||||
| US and Utilities SBU | $ | 978 | $ | 983 | $ | 4,230 | $ | 4,162 | |||||||
| South America SBU | 869 | 875 | 3,533 | 3,252 | |||||||||||
| MCAC SBU | 452 | 399 | 1,728 | 1,519 | |||||||||||
| Eurasia SBU | 320 | 386 | 1,255 | 1,590 | |||||||||||
| Corporate, Other and Eliminations | 3 | — | (10 | ) | 7 | ||||||||||
| Total Revenue | $ | 2,622 | $ | 2,643 | $ | 10,736 | $ | 10,530 | |||||||
| THE AES CORPORATION | ||||||||
| Consolidated Balance Sheets | ||||||||
December 31, | December 31, | |||||||
| (in millions, except share and per share data) | ||||||||
| ASSETS | ||||||||
| CURRENT ASSETS | ||||||||
| Cash and cash equivalents | $ | 1,166 | $ | 949 | ||||
| Restricted cash | 370 | 274 | ||||||
| Short-term investments | 313 | 424 | ||||||
| Accounts receivable, net of allowance for doubtful accounts of $23 and $10, respectively | 1,595 | 1,463 | ||||||
| Inventory | 577 | 562 | ||||||
| Prepaid expenses | 130 | 62 | ||||||
| Other current assets | 807 | 630 | ||||||
| Current assets of discontinued operations and held-for-sale businesses | 57 | 2,034 | ||||||
| Total current assets | 5,015 | 6,398 | ||||||
| NONCURRENT ASSETS | ||||||||
| Property, Plant and Equipment: | ||||||||
| Land | 449 | 502 | ||||||
| Electric generation, distribution assets and other | 25,242 | 24,119 | ||||||
| Accumulated depreciation | (8,227 | ) | (7,942 | ) | ||||
| Construction in progress | 3,932 | 3,617 | ||||||
| Property, plant and equipment, net | 21,396 | 20,296 | ||||||
| Other Assets: | ||||||||
| Investments in and advances to affiliates | 1,114 | 1,197 | ||||||
| Debt service reserves and other deposits | 467 | 565 | ||||||
| Goodwill | 1,059 | 1,059 | ||||||
| Other intangible assets, net of accumulated amortization of $457 and $441, respectively | 436 | 366 | ||||||
| Deferred income taxes | 97 | 130 | ||||||
| Service concession assets, net of accumulated amortization of $0 and $206, respectively | — | 1,360 | ||||||
| Loan receivable | 1,423 | — | ||||||
| Other noncurrent assets | 1,514 | 1,741 | ||||||
| Total other assets | 6,110 | 6,418 | ||||||
| TOTAL ASSETS | $ | 32,521 | $ | 33,112 | ||||
| LIABILITIES AND EQUITY | ||||||||
| CURRENT LIABILITIES | ||||||||
| Accounts payable | $ | 1,329 | $ | 1,371 | ||||
| Accrued interest | 191 | 228 | ||||||
| Accrued non-income taxes | 250 | 252 | ||||||
| Accrued and other liabilities | 962 | 980 | ||||||
| Non-recourse debt, including $479 and $1,012, respectively, related to variable interest entities | 1,659 | 2,164 | ||||||
| Current liabilities of discontinued operations and held-for-sale businesses | 8 | 1,033 | ||||||
| Total current liabilities | 4,399 | 6,028 | ||||||
| NONCURRENT LIABILITIES | ||||||||
| Recourse debt | 3,650 | 4,625 | ||||||
| Non-recourse debt, including $2,922 and $1,358 respectively, related to variable interest entities | 13,986 | 13,176 | ||||||
| Deferred income taxes | 1,280 | 1,006 | ||||||
| Other noncurrent liabilities | 2,723 | 2,595 | ||||||
| Total noncurrent liabilities | 21,639 | 21,402 | ||||||
| Commitments and Contingencies | ||||||||
| Redeemable stock of subsidiaries | 879 | 837 | ||||||
| EQUITY | ||||||||
| THE AES CORPORATION STOCKHOLDERS’ EQUITY | ||||||||
| Common stock ($0.01 par value, 1,200,000,000 shares authorized; 817,203,691 issued and 662,298,096 outstanding at December 31, 2018 and 816,312,913 issued and 660,388,128 outstanding at December 31, 2017) | 8 | 8 | ||||||
| Additional paid-in capital | 8,154 | 8,501 | ||||||
| Accumulated deficit | (1,005 | ) | (2,276 | ) | ||||
| Accumulated other comprehensive loss | (2,071 | ) | (1,876 | ) | ||||
| Treasury stock, at cost (154,905,595 and 155,924,785 shares at December 31, 2018 and 2017, respectively) | (1,878 | ) | (1,892 | ) | ||||
| Total AES Corporation stockholders’ equity | 3,208 | 2,465 | ||||||
| NONCONTROLLING INTERESTS | 2,396 | 2,380 | ||||||
| Total equity | 5,604 | 4,845 | ||||||
| TOTAL LIABILITIES AND EQUITY | $ | 32,521 | $ | 33,112 | ||||
| THE AES CORPORATION | ||||||||||||||||
| Consolidated Statements of Cash Flows | ||||||||||||||||
| (Unaudited) | ||||||||||||||||
Three Months Ended | Year Ended | |||||||||||||||
| 2018 | 2017 | 2018 | 2017 | |||||||||||||
| OPERATING ACTIVITIES: | (in millions) | (in millions) | ||||||||||||||
| Net income (loss) | $ | 181 | $ | (1,286 | ) | $ | 1,565 | $ | (777 | ) | ||||||
| Adjustments to net income (loss): | ||||||||||||||||
| Depreciation and amortization | 233 | 285 | 1,003 | 1,169 | ||||||||||||
| Loss (gain) on disposal and sale of business interests | (128 | ) | 3 | (984 | ) | 52 | ||||||||||
| Impairment expenses | 183 | 277 | 355 | 537 | ||||||||||||
| Deferred income taxes | 92 | 675 | 313 | 672 | ||||||||||||
| Provisions for contingencies | 13 | 4 | 14 | 34 | ||||||||||||
| Loss on extinguishment of debt | 1 | 24 | 188 | 68 | ||||||||||||
| Loss on sale and disposal of assets | 4 | 9 | 27 | 43 | ||||||||||||
| Net loss (gain) from disposal and impairments of discontinued businesses | (26 | ) | 611 | (269 | ) | 611 | ||||||||||
| Other | 111 | 87 | 317 | 160 | ||||||||||||
| Changes in operating assets and liabilities: | ||||||||||||||||
| (Increase) decrease in accounts receivable | (81 | ) | 102 | (206 | ) | (177 | ) | |||||||||
| (Increase) decrease in inventory | (23 | ) | 38 | (36 | ) | (28 | ) | |||||||||
| (Increase) decrease in prepaid expenses and other current assets | (37 | ) | (33 | ) | (22 | ) | 107 | |||||||||
| (Increase) decrease in other assets | (10 | ) | (29 | ) | (32 | ) | (295 | ) | ||||||||
| Increase (decrease) in accounts payable and other current liabilities | 91 | 1 | 62 | 163 | ||||||||||||
| Increase (decrease) in income tax payables, net and other tax payables | 54 | 57 | (7 | ) | 53 | |||||||||||
| Increase (decrease) in other liabilities | 4 | (22 | ) | 55 | 112 | |||||||||||
| Net cash provided by operating activities | 662 | 803 | 2,343 | 2,504 | ||||||||||||
| INVESTING ACTIVITIES: | ||||||||||||||||
| Capital expenditures | (529 | ) | (590 | ) | (2,121 | ) | (2,177 | ) | ||||||||
| Acquisitions of business interests, net of cash and restricted cash acquired | — | (19 | ) | (66 | ) | (609 | ) | |||||||||
| Proceeds from the sale of business interests, net of cash and restricted cash sold | 224 | 69 | 2,020 | 108 | ||||||||||||
| Sale of short-term investments | 292 | 598 | 1,302 | 3,540 | ||||||||||||
| Purchase of short-term investments | (196 | ) | (637 | ) | (1,411 | ) | (3,310 | ) | ||||||||
| Contributions to equity investments | (44 | ) | (40 | ) | (145 | ) | (89 | ) | ||||||||
| Other investing | (62 | ) | (25 | ) | (84 | ) | (62 | ) | ||||||||
| Net cash used in investing activities | (315 | ) | (644 | ) | (505 | ) | (2,599 | ) | ||||||||
| FINANCING ACTIVITIES: | ||||||||||||||||
| Borrowings under the revolving credit facilities | 431 | 667 | 1,865 | 2,156 | ||||||||||||
| Repayments under the revolving credit facilities | (643 | ) | (891 | ) | (2,238 | ) | (1,742 | ) | ||||||||
| Issuance of recourse debt | — | — | 1,000 | 1,025 | ||||||||||||
| Repayments of recourse debt | (152 | ) | — | (1,933 | ) | (1,353 | ) | |||||||||
| Issuance of non-recourse debt | 419 | 519 | 1,928 | 3,222 | ||||||||||||
| Repayments of non-recourse debt | (272 | ) | (629 | ) | (1,411 | ) | (2,360 | ) | ||||||||
| Payments for financing fees | (7 | ) | (4 | ) | (39 | ) | (100 | ) | ||||||||
| Distributions to noncontrolling interests | (141 | ) | (161 | ) | (340 | ) | (424 | ) | ||||||||
| Contributions from noncontrolling interests and redeemable security holders | 3 | 14 | 43 | 73 | ||||||||||||
| Dividends paid on AES common stock | (86 | ) | (79 | ) | (344 | ) | (317 | ) | ||||||||
| Payments for financed capital expenditures | (89 | ) | (79 | ) | (275 | ) | (179 | ) | ||||||||
| Proceeds from sales to noncontrolling interests, net of transaction costs | — | 34 | — | 94 | ||||||||||||
| Other financing | 57 | (26 | ) | 101 | (52 | ) | ||||||||||
| Net cash provided by (used in) financing activities | (480 | ) | (635 | ) | (1,643 | ) | 43 | |||||||||
| Effect of exchange rate changes on cash, cash equivalents and restricted cash | (4 | ) | (13 | ) | (54 | ) | 8 | |||||||||
| (Increase) decrease in cash, cash equivalents and restricted cash of discontinued operations and held-for-sale businesses | 18 | (21 | ) | 74 | (128 | ) | ||||||||||
| Total increase (decrease) in cash, cash equivalents and restricted cash | (119 | ) | (510 | ) | 215 | (172 | ) | |||||||||
| Cash, cash equivalents and restricted cash, beginning | 2,122 | 2,298 | 1,788 | 1,960 | ||||||||||||
| Cash, cash equivalents and restricted cash, ending | $ | 2,003 | $ | 1,788 | $ | 2,003 | $ | 1,788 | ||||||||
| SUPPLEMENTAL DISCLOSURES: | ||||||||||||||||
| Cash payments for interest, net of amounts capitalized | $ | 320 | $ | 399 | $ | 1,003 | $ | 1,196 | ||||||||
| Cash payments for income taxes, net of refunds | 57 | 86 | 370 | 377 | ||||||||||||
| SCHEDULE OF NONCASH INVESTING AND FINANCING ACTIVITIES: | ||||||||||||||||
| Non-cash acquisition of intangible assets | 2 | — | 16 | — | ||||||||||||
| Non-cash contributions of assets and liabilities for the Fluence transaction | — | — | 20 | — | ||||||||||||
| Non-cash exchange of debentures for the acquisition of the Guaimbê Solar Complex | — | — | 119 | — | ||||||||||||
| Non-cash acquisition of the remaining interest in a Distributed Energy equity affiliate | 23 | — | 23 | — | ||||||||||||
| Dividends declared but not yet paid | 90 | 86 | 90 | 86 | ||||||||||||
| Conversion of Alto Maipo loans and accounts payable into equity | — | — | — | 279 | ||||||||||||
| Return Share Transfer Payment due | — | 75 | — | 75 | ||||||||||||
THE AES CORPORATION |
NON-GAAP FINANCIAL MEASURES |
(Unaudited) |
RECONCILIATION OF ADJUSTED PRE-TAX CONTRIBUTION (PTC) AND ADJUSTED EPS |
Adjusted PTC is defined as pre-tax income from continuing operations attributable to The AES Corporation excluding gains or losses of the consolidated entity due to (a) unrealized gains or losses related to derivative transactions and equity securities; (b) unrealized foreign currency gains or losses; (c) gains, losses, benefits and costs associated with dispositions and acquisitions of business interests, including early plant closures; (d) losses due to impairments; (e) gains, losses and costs due to the early retirement of debt; and (f) costs directly associated with a major restructuring program, including, but not limited to, workforce reduction efforts, relocations and office consolidation. Adjusted PTC also includes net equity in earnings of affiliates on an after-tax basis adjusted for the same gains or losses excluded from consolidated entities. |
Adjusted EPS is defined as diluted earnings per share from continuing operations excluding gains or losses of both consolidated entities and entities accounted for under the equity method due to (a) unrealized gains or losses related to derivative transactions and equity securities; (b) unrealized foreign currency gains or losses; (c) gains, losses, benefits and costs associated with dispositions and acquisitions of business interests, including early plant closures, and the tax impact from the repatriation of sales proceeds; (d) losses due to impairments; (e) gains, losses and costs due to the early retirement of debt; (f) costs directly associated with a major restructuring program, including, but not limited to, workforce reduction efforts, relocations and office consolidation; and (g) tax benefit or expense related to the enactment effects of 2017 U.S. tax law reform and related regulations and any subsequent period adjustments related to enactment effects. |
The GAAP measure most comparable to Adjusted PTC is income from continuing operations attributable to AES. The GAAP measure most comparable to Adjusted EPS is diluted earnings per share from continuing operations. We believe that Adjusted PTC and Adjusted EPS better reflect the underlying business performance of the Company and are considered in the Company’s internal evaluation of financial performance. Factors in this determination include the variability due to unrealized gains or losses related to derivative transactions or equity securities remeasurement, unrealized foreign currency gains or losses, losses due to impairments and strategic decisions to dispose of or acquire business interests, retire debt or implement restructuring initiatives, which affect results in a given period or periods. In addition, for Adjusted PTC, earnings before tax represents the business performance of the Company before the application of statutory income tax rates and tax adjustments, including the effects of tax planning, corresponding to the various jurisdictions in which the Company operates. Given its large number of businesses and complexity, the Company concluded that Adjusted PTC is a more transparent measure that better assists investors in determining which businesses have the greatest impact on the Company's results. Adjusted PTC and Adjusted EPS should not be construed as alternatives to income from continuing operations attributable to AES and diluted earnings per share from continuing operations, respectively, which are determined in accordance with GAAP. |
Effective January 1, 2018, the Company changed the definitions of Adjusted PTC and Adjusted EPS to exclude unrealized gains or losses from equity securities resulting from a newly effective accounting standard. We believe excluding these gains or losses provides a more accurate picture of continuing operations. Factors in this determination include the variability due to unrealized gains or losses related to equity securities remeasurement. The Company has also reflected these changes in the comparative period. |
| THE AES CORPORATION | ||||||||||||||||||||||||||||||||||||||||
| NON-GAAP FINANCIAL MEASURES | ||||||||||||||||||||||||||||||||||||||||
| (Unaudited) | ||||||||||||||||||||||||||||||||||||||||
| RECONCILIATION OF ADJUSTED PRE-TAX CONTRIBUTION (PTC) AND ADJUSTED EPS | ||||||||||||||||||||||||||||||||||||||||
Three Months Ended | Three Months Ended | Twelve Months Ended | Twelve Months Ended | |||||||||||||||||||||||||||||||||||||
Net of NCI (1) |
Per Share | Net of NCI (1) |
Per Share | Net of NCI (1) |
Per Share | Net of NCI (1) |
Per Share | |||||||||||||||||||||||||||||||||
| (in millions, except per share amounts) | ||||||||||||||||||||||||||||||||||||||||
| Income (loss) from continuing operations, net of tax, attributable to AES and Diluted EPS | $ | 102 | $ | 0.15 | $ | (683 | ) | $ | (1.03 | ) | $ | 985 | $ | 1.48 | $ | (507 | ) | $ | (0.76 | ) | (2) | |||||||||||||||||||
| Add: Income tax expense attributable to AES | 152 | 689 | 563 | 828 | ||||||||||||||||||||||||||||||||||||
| Pre-tax contribution | $ | 254 | $ | 6 | $ | 1,548 | $ | 321 | ||||||||||||||||||||||||||||||||
| Adjustments | ||||||||||||||||||||||||||||||||||||||||
| Unrealized derivative and equity securities losses (gains) | $ | 29 | $ | 0.05 | $ | 4 | $ | 0.01 | $ | 33 | $ | 0.05 | $ | (3 | ) | $ | — | |||||||||||||||||||||||
| Unrealized foreign currency losses (gains) | 9 | 0.02 | (5 | ) | (0.01 | ) | 51 | 0.09 | (3) | (59 | ) | (0.10 | ) | |||||||||||||||||||||||||||
| Disposition/acquisition losses (gains) | (112 | ) | (0.17 | ) | (4) | 14 | 0.02 | (934 | ) | (1.41 | ) | (5) | 123 | 0.19 | (6) | |||||||||||||||||||||||||
| Impairment expense | 135 | 0.20 | (7) | 278 | 0.42 | (8) | 307 | 0.46 | (9) | 542 | 0.82 | (10) | ||||||||||||||||||||||||||||
| Loss on extinguishment of debt | 3 | — | 19 | 0.03 | (11) | 180 | 0.27 | (12) | 62 | 0.09 | (13) | |||||||||||||||||||||||||||||
| Restructuring costs | (3 | ) | — | 31 | 0.05 | — | — | 31 | 0.05 | |||||||||||||||||||||||||||||||
| U.S. Tax Law Reform Impact | 0.13 | (14) | 1.08 | (15) | 0.18 | (16) | 1.08 | (15) | ||||||||||||||||||||||||||||||||
| Less: Net income tax expense (benefit) | (0.02 | ) | (0.14 | ) | (17) | 0.12 | (18) | (0.29 | ) | (19) | ||||||||||||||||||||||||||||||
| Adjusted PTC and Adjusted EPS | $ | 315 | $ | 0.36 | $ | 347 | $ | 0.43 | $ | 1,185 | $ | 1.24 | $ | 1,017 | $ | 1.08 | ||||||||||||||||||||||||
| _____________________________ | ||
| (1) | NCI is defined as Noncontrolling Interests | |
| (2) | In calculating diluted loss per share under GAAP of ($0.77), the Company excluded common stock equivalents from the weighted average shares as their inclusion would be anti-dilutive. However, for purposes of calculating Adjusted EPS, the impact of anti-dilutive common stock equivalents of $0.01 was included, resulting in Non-GAAP diluted loss per share of ($0.76). | |
| (3) | Amount primarily relates to unrealized FX losses of $22 million, or $0.03 per share, associated with the devaluation of long-term receivables denominated in Argentine pesos, and unrealized FX losses of $14 million, or $0.02 per share, on intercompany receivables denominated in Euros and British pounds at the Parent Company. | |
| (4) | Amount primarily relates to gain on sale of CTNG of $86 million, or $0.13 per share and gain on remeasurement of contingent consideration at AES Oahu of $32 million, or $0.05 per share. | |
| (5) | Amount primarily relates to gain on sale of Masinloc of $772 million, or $1.16 per share, gain on sale of CTNG of $86 million, or $0.13 per share, gain on sale of Electrica Santiago of $36 million, or $0.05 per share, gain on remeasurement of contingent consideration at AES Oahu of $32 million, or $0.05 per share, gain on sale related to the Company's contribution of AES Advancion energy storage to the Fluence joint venture of $23 million, or $0.03 per share and realized derivative gains associated with the sale of Eletropaulo of $21 million, or $0.03 per share; partially offset by loss on disposal of the Beckjord facility and additional shutdown costs related to Stuart and Killen at DPL of $21 million, or $0.03 per share. | |
| (6) | Amount primarily relates to loss on sale of Kazakhstan CHPs of $49 million, or $0.07 per share, realized derivative losses associated with the sale of Sul of $38 million, or $0.06 per share, loss on sale of Kazakhstan HPPs of $33 million, or $0.05 per share, and costs associated with early plant closures at DPL of $24 million, or $0.04 per share; partially offset by gain on Masinloc contingent consideration of $23 million, or $0.03 per share and gain on sale of Miami Fort and Zimmer of $13 million, or $0.02 per share. | |
| (7) | Amount primarily relates to asset impairment at Nejapa of $37 million, or $0.06 per share and other-than-temporary impairment of Guacolda of $96 million, or $0.14 per share. | |
| (8) | Amount primarily relates to asset impairments at Laurel Mountain of $121 million, or $0.18 per share and DPL of $109 million, or $0.17 per share. | |
| (9) | Amount primarily relates to asset impairments at Shady Point of $157 million, or $0.24 per share, and Nejapa of $37 million, or $0.06 per share, and other-than-temporary impairment of Guacolda of $96 million, or $0.14 per share. | |
| (10) | Amount primarily relates to asset impairments at Kazakhstan CHPs of $94 million, or $0.14 per share, at Kazakhstan HPPs of $92 million, or $0.14 per share, at Laurel Mountain of $121 million, or $0.18 per share, at DPL of $175 million, or $0.27 per share and at Kilroot of $37 million, or $0.05 per share. | |
| (11) | Amount primarily relates to losses on early retirement of debt at AES Gener of $20 million, or $0.02 per share. | |
| (12) | Amount primarily relates to loss on early retirement of debt at the Parent Company of $171 million, or $0.26 per share. | |
| (13) | Amount primarily relates to losses on early retirement of debt at the Parent Company of $92 million, or $0.14 per share, at AES Gener of $20 million, or $0.02 per share, and at IPALCO of $9 million or $0.01 per share; partially offset by a gain on early retirement of debt at AES Argentina of $65 million, or $0.10 per share. | |
| (14) | Amount relates to a SAB 118 charge to finalize the provisional estimate of one-time transition tax on foreign earnings of $161 million, or $0.24 per share, partially offset by a SAB 118 income tax benefit to finalize the provisional estimate of remeasurement of deferred tax assets and liabilities to the lower corporate tax rate of $77 million, or $0.11 per share. | |
| (15) | Amount relates to a one-time transition tax on foreign earnings of $675 million, or $1.02 per share and the remeasurement of deferred tax assets and liabilities to the lower corporate tax rate of $39 million, or $0.06 per share. | |
| (16) | Amount relates to a SAB 118 charge to finalize the provisional estimate of one-time transition tax on foreign earnings of $194 million, or $0.29 per share, partially offset by a SAB 118 income tax benefit to finalize the provisional estimate of remeasurement of deferred tax assets and liabilities to the lower corporate tax rate of $77 million, or $0.11 per share. | |
| (17) | Amount primarily relates to the income tax benefit associated with asset impairment losses and restructuring costs of $66 million, or $0.10 and $10 million or $0.02 per share respectively for the three months ended December 31, 2017. | |
| (18) | Amount primarily relates to the income tax expense under the GILTI provision associated with the gains on sales of business interests, primarily Masinloc, of $97 million, or $0.15 per share, and income tax expense associated with gains on sale of CTNG of $36 million, or $0.05 per share and Electrica Santiago of $13 million, or $0.02 per share; partially offset by income tax benefits associated with the loss on early retirement of debt at the Parent Company of $36 million, or $0.05 per share, and income tax benefits associated with the impairment at Shady Point of $33 million, or $0.05 per share. | |
| (19) | Amount primarily relates to the income tax benefit associated with asset impairments of $148 million, or $0.22 per share. | |
| The AES Corporation | ||||
| Non-GAAP Financial Measures | ||||
Parent Company Cash Flow | 2018 | |||
| Subsidiary Distributions1 (a) | $ | 1,186 | ||
| Cash Interest (b) | $ | (244 | ) | |
| Corporate Overhead | $ | (187 | ) | |
| Parent-Funded SBU Overhead | $ | (51 | ) | |
| Business Development/Taxes | $ | (15 | ) | |
| Cash for Development, General & Administrative and Tax (c) | $ | (250 | ) | |
| Parent Free Cash Flow2 (a - b - c) | $ | 689 | ||
1 | Subsidiary Distributions should not be construed as an alternative to Net Cash Provided by Operating Activities which is determined in accordance with GAAP. Subsidiary Distributions are important to the Parent Company because the Parent Company is a holding company that does not derive any significant direct revenues from its own activities but instead relies on its subsidiaries’ business activities and the resultant distributions to fund the debt service, investment and other cash needs of the holding company. The reconciliation of the difference between the Subsidiary Distributions and Net Cash Provided by Operating Activities consists of cash generated from operating activities that is retained at the subsidiaries for a variety of reasons which are both discretionary and non-discretionary in nature. These factors include, but are not limited to, retention of cash to fund capital expenditures at the subsidiary, cash retention associated with non-recourse debt covenant restrictions and related debt service requirements at the subsidiaries, retention of cash related to sufficiency of local GAAP statutory retained earnings at the subsidiaries, retention of cash for working capital needs at the subsidiaries, and other similar timing differences between when the cash is generated at the subsidiaries and when it reaches the Parent Company and related holding companies. | |
| 2 | Parent Free Cash Flow (a non-GAAP financial measure) should not be construed as an alternative to Net Cash Provided by Operating Activities which is determined in accordance with GAAP. Parent Free Cash Flow is equal to Subsidiary Distributions less cash used for interest costs, development, general and administrative activities, and tax payments by the Parent Company. Parent Free Cash Flow is used for dividends, share repurchases, growth investments, recourse debt repayments, and other uses by the Parent Company. | |
| The AES Corporation | |||||||||||||||
| Parent Financial Information | |||||||||||||||
| Parent only data: last four quarters | |||||||||||||||
| (in millions) | 4 Quarters Ended | ||||||||||||||
Total subsidiary distributions & returns of capital to Parent | December 31, | September 30, | June 30, | March 31, | |||||||||||
| Actual | Actual | Actual | Actual | ||||||||||||
| Subsidiary distributions (1) to Parent & QHCs | $ | 1,186 | $ | 1,255 | $ | 1,240 | $ | 1,345 | |||||||
| Returns of capital distributions to Parent & QHCs | — | (67 | ) | (65 | ) | — | |||||||||
| Total subsidiary distributions & returns of capital to Parent | $ | 1,186 | $ | 1,188 | $ | 1,175 | $ | 1,345 | |||||||
| Parent only data: quarterly | |||||||||||||||
| (in millions) | Quarter Ended | ||||||||||||||
Total subsidiary distributions & returns of capital to Parent | December 31, | September 30, | June 30, | March 31, | |||||||||||
| Actual | Actual | Actual | Actual | ||||||||||||
| Subsidiary distributions (1) to Parent & QHCs | $ | 390 | $ | 175 | $ | 270 | $ | 351 | |||||||
| Returns of capital distributions to Parent & QHCs | — | — | — | — | |||||||||||
| Total subsidiary distributions & returns of capital to Parent | $ | 390 | $ | 175 | $ | 270 | $ | 351 | |||||||
Parent Company Liquidity (2) | |||||||||||||||
| (in millions) | Balance at | ||||||||||||||
December 31, | September 30, | June 30, | March 31, | ||||||||||||
| Actual | Actual | Actual | Actual | ||||||||||||
| Cash at Parent & Cash at QHCs (3) | $ | 24 | $ | 43 | $ | 151 | $ | 76 | |||||||
| Availability under credit facilities | 1,022 | 1,042 | 687 | 807 | |||||||||||
| Ending liquidity | $ | 1,046 | $ | 1,085 | $ | 838 | $ | 883 | |||||||
| _____________________________ | ||
(1) | Subsidiary distributions should not be construed as an alternative to Net Cash Provided by Operating Activities which is determined in accordance with GAAP. Subsidiary distributions are important to the Parent Company because the Parent Company is a holding company that does not derive any significant direct revenues from its own activities but instead relies on its subsidiaries’ business activities and the resultant distributions to fund the debt service, investment and other cash needs of the holding company. The reconciliation of the difference between the subsidiary distributions and the Net Cash Provided by Operating Activities consists of cash generated from operating activities that is retained at the subsidiaries for a variety of reasons which are both discretionary and non-discretionary in nature. These factors include, but are not limited to, retention of cash to fund capital expenditures at the subsidiary, cash retention associated with non-recourse debt covenant restrictions and related debt service requirements at the subsidiaries, retention of cash related to sufficiency of local GAAP statutory retained earnings at the subsidiaries, retention of cash for working capital needs at the subsidiaries, and other similar timing differences between when the cash is generated at the subsidiaries and when it reaches the Parent Company and related holding companies. | |
(2) | Parent Company Liquidity is defined as cash at the Parent Company plus available borrowings under existing credit facility plus cash at qualified holding companies (QHCs). AES believes that unconsolidated Parent Company liquidity is important to the liquidity position of AES as a Parent Company because of the non-recourse nature of most of AES’ indebtedness. | |
(3) | The cash held at QHCs represents cash sent to subsidiaries of the company domiciled outside of the US. Such subsidiaries had no contractual restrictions on their ability to send cash to AES, the Parent Company. Cash at those subsidiaries was used for investment and related activities outside of the US. These investments included equity investments and loans to other foreign subsidiaries as well as development and general costs and expenses incurred outside the US. Since the cash held by these QHCs is available to the Parent, AES uses the combined measure of subsidiary distributions to Parent and QHCs as a useful measure of cash available to the Parent to meet its international liquidity needs. | |
View source version on businesswire.com: https://www.businesswire.com/news/home/20190227005185/en/
Contacts:
Media Contact: Amy
Ackerman 703-682-6399
