Up, down and all around. That is the nature of a trading range.
Not as much fun as a bull run...but a natural pause for investors to catch their breath before the next run higher.
When will that be? And what will be the catalyst?
We will discuss these vital topics and more in today’s Reitmeister Total Return commentary.
Market Commentary
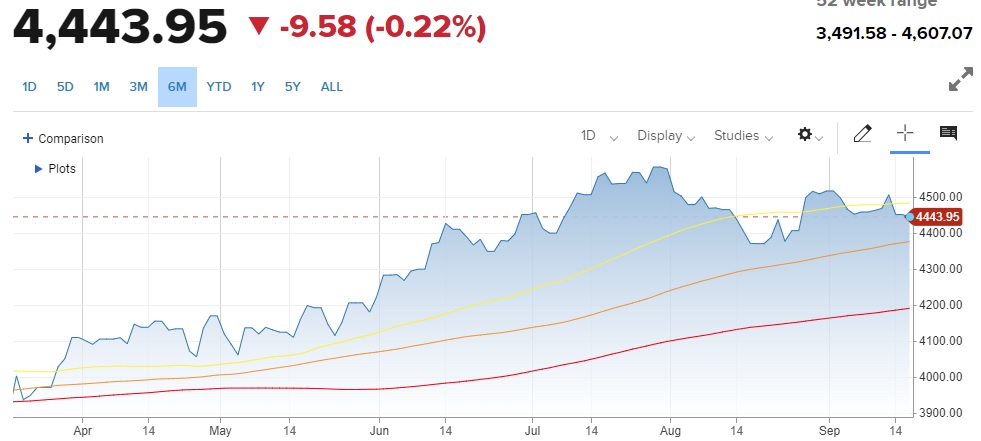
We are in a bull market, but stuck in a short term trading range between 4,374 and 4,600 on the S&P 500 (SPY).
Why a bull market?
Because most all signs point to a soft landing for the economy even though the Fed embarked on the most aggressive rate hiking regime in history.
Please don’t credit the Fed for this soft landing miracle. That’s because 12 of the last 15 times they raised rates leading to a recession. Heck, they even a predicted a recession would come from their hawkish actions.
The only reason a recession is not happening this time around is the strength of the employment market. And that was borne of more than 2 million Americans choosing early retirement during Covid, which led to a very good job market for anyone seeking employment.
So no matter how hard the Fed stepped on the throat of the economy with higher and higher rates...they couldn’t stop employers from filling vacancies with other employees. This kept income flowing...which kept spending flowing...which averted a recession.
We could go point for point on the economic indicators, but at the end of the day the main thing that matters is GDP. That rang in at +2.1% last quarter. And the current estimate from coveted GDP Now Model points to +4.9% in Q3.
Note it is very early in the quarter and expect the model to come in a bit closer to the Blue Chip Economist panel calling for something more like 3% GDP growth. Yet even still that is an impressive feat with rates this high for the purpose of tamping down inflation.
The concern at this moment is that, perhaps, the economy is a tad too strong. And with that will come more inflationary pressures which leads to a more hawkish Fed (higher rates for longer) and that increases the odds of recession down the road.
This is the fundamental reason behind the pause in the bull rally leading to our current trading range. But as shared in recent commentaries, most economists continue to decrease their odds of a recession forming in the coming year. That includes Goldman Sachs now seeing only 15% chance of a recession in the year ahead.
At this moment, investors are holding their breath for what the Fed will say on Wednesday. It is nearly unanimously agreed upon that they will hold rates at current levels. So what really matters is the speech given by Powell and what that tells us about the dot plot of rates in the months ahead.
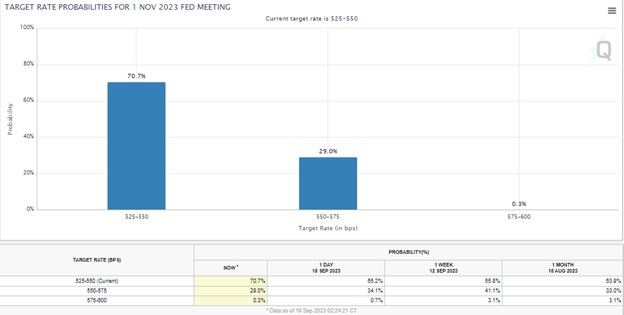
Just one week ago investors were expecting 44% chance of a rate hike at the November meeting after this pause. That is now down to 29% given the positive indications in this month’s CPI and PPI inflation reports.

The Fed prides itself on the consistency and clarity of its message. So, barring some miracle I expect on Wednesday that Powell will repeat similar themes from past:
- More work to do to get inflation down to 2% target
- Higher rates for longer
- Are open to raising rates in the future...but are data dependent
What will be interesting is if there are changes in the statements about when they might lower rates. Or the state of the economy at that time (which they recently changed from recession to soft landing). Those changes could have market moving impact.
Price Action & Trading Plan

Moving Averages: 50 Day (yellow), 100 Day (orange), 200 Day (red)
As noted above, we are in a long term market, but mired in a short term trading range.
The 100 day moving a is coming back into play as it was in mid August. Now that support level is up to 4,371 whereas the Tuesday low was 4,416.
I think there is not much logical reason to press below that point. But you never know what the next headline will read...or if Powell throws a curve ball at his 9/20 press conference.
So, if that did happen leading to a break under the 100 day...then the next big level of support would be the 200 day moving average now at 4,186.
That would equate to a nearly 10% pullback from the recent highs. And a proper expelling of excess in the market. So that level of 4,200 is possible, but not probable given the current fundamental facts in hand that should have stocks bouncing before that notion.
Adding it altogether the trading range that started the beginning of August is still intact. That being framed by the 100 day moving average (4,371) on the low side and 4,600 on the high side.
Most trading ranges end with stocks moving in the same direction as before the trading range. In that case, it would be a resumption of the bull market.
That is just the technical picture. The fundamental picture was shared above. Namely that we seem to be on track for a soft landing for the economy as inflation cools down. This points to a likely lowering of rates and resumption of earnings growth in 2024. Indeed, that is a strong catalyst for future stock advances.
We may currently be in a trading range...but what comes next is likely another bull run higher. That is why I remain fully invested in the best collection of stocks and ETF. More details on those in the next section...
What To Do Next?
Discover my current portfolio of 7 stocks packed to the brim with the outperforming benefits found in our POWR Ratings model.
Plus I have added 4 ETFs that are all in sectors well positioned to outpace the market in the weeks and months ahead.
This is all based on my 43 years of investing experience seeing bull markets...bear markets...and everything between.
If you are curious to learn more, and want to see these 11 hand selected trades, then please click the link below to get started now.
Steve Reitmeister’s Trading Plan & Top Picks >
Wishing you a world of investment success!

Steve Reitmeister…but everyone calls me Reity (pronounced “Righty”)
CEO, StockNews.com and Editor, Reitmeister Total Return
SPY shares were trading at $442.71 per share on Tuesday afternoon, down $0.92 (-0.21%). Year-to-date, SPY has gained 16.64%, versus a % rise in the benchmark S&P 500 index during the same period.
About the Author: Steve Reitmeister

Steve is better known to the StockNews audience as “Reity”. Not only is he the CEO of the firm, but he also shares his 40 years of investment experience in the Reitmeister Total Return portfolio. Learn more about Reity’s background, along with links to his most recent articles and stock picks.
The post Why the Bull Market is Still in Charge? appeared first on StockNews.com