
The traditional investment media has a bad habit.
Each and every day they want to write articles that have a cause and effect. As in “the market was down today because of reason X”. And the next day when the market is up they want to draw new conclusions that quite often contradict the previous day.
Yet when the market is volatile, as it is now, these narratives are pointless and silly because there truly is no difference today versus yesterday. Just like trying to explain the big drop on Thursday after the massive rally on Wednesday. Nothing has really changed other than stock prices.
When the market is volatile it begs us to pull back to the big picture to put everything into perspective. That is exactly what we will do in my commentary today.
Market Commentary
We will begin by sharing the key opening statements from my last commentary: Why Are Stocks So Unsettled?
“Let’s start with the big picture.
That being we are in the midst of long term bull market that started October 2022. And given that the average bull market lasts a little over 5 years...then likely we have a lot more time and upside still to come.
On the other hand, the early stages of a bull market offer the most impressive gains as stocks bounce from oversold conditions. That explains the +62% peak to valley tally for the S&P 500 (SPY) in less than two years. And explains why investors are keen to take some of those profits off the table from time to time.
Now is as good a time as any for that to happen even as certainty over Fed rate cuts grow.”
And that certainty of looming rate cuts only increased on Wednesday after the Fed’s announcement and press conference. The door is now wide open to start cutting at the September 18th meeting.
Investors are currently putting a 100% probability on cuts starting at that meeting. Interestingly, the odds of a larger 50 basis point cut has increased from 5% just a month ago to 20%.
This positive news confuses many investors on how the very next day stocks could be in outright freefall as best expressed by the -3% loss for the small caps in the Russell 2000.
The answer is simple: “Buy the rumor and SELL the news”
Plain and simple, investors already priced in Fed rate hikes leading to the 62% valley to recent peak gain for the S&P 500 since the bear market lows of 2022. That is far greater than the average annual pace of gains closer to 8% for stocks. Thus, only makes sense that investors take a breather at this point.
That is what happened Thursday. And likely will be part of ongoing volatility for a while.
First, because the overall market is fairly valued after the big run up.
Second, you have the uncertainty over the Presidential Election which has paved the way for notable pullbacks/corrections the last 3 election cycles.
Now I suspect investors are in the mood to test some key support levels:
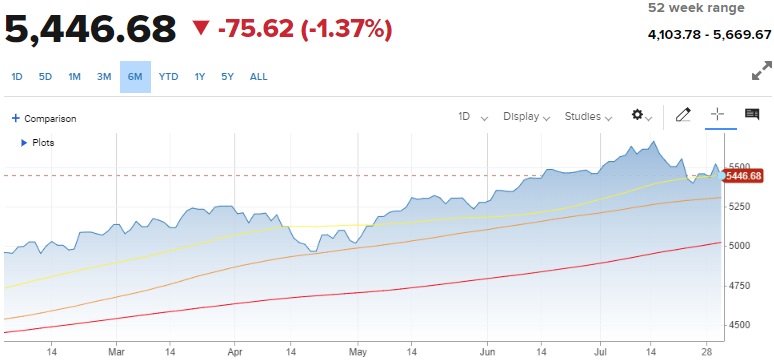
Moving Averages: 50 Day (yellow) @ 5,449 > 100 Day (orange) @ 5,305 > 200 Day (red) @ 5,003
Stocks have been flitting all around the 50 day moving average for a couple weeks. And we closed below once again on Thursday. This increases the odds of more downside on the way which puts the 100 day moving average at 5,305 in the cross hairs.
That represents only a 6.3% drop from the recent highs. No one should sweat that given the ample gains in hand this year (and back to October 2022). But could be enough to shake complacency out of this market after gains were too fast and too easy for too long.
Especially true for folks who rode the Magnificent 7 to bloated heights. They got too used to gains in all market conditions and need to be reminded that even those stock prices can come down.
The greater question is whether the 200 day moving average (aka long term trend line) will come under attack. That would be a more painful 12% drop from the highs. But is the type of stiff correction that does come about every 1-2 years.
This is quite possible, but am not certain we will end up touching the 200 day moving average. Yet I would put greater than 50/50 odds on the 100 day moving average being reached prior to the election.
(Friday morning update: Yes, I put this commentary to rest Thursday night to send out first thing this morning. But the market shift, and an early AM appointment has me sending a touch later. So only right that I mention this morning’s action.
Yes, Government Employment Situation report softer than expected which matches up with the soft reading for ISM Manufacturing. This should not be a surprise to ANYONE given the Fed’s goal to generate a soft landing for the economy that would also tame inflation.
This only further guarantees that rate cuts are coming...and maybe at a more aggressive pace. And that will boost the economy making sure the soft landing is short and shallow.
This just creates an easy excuse to take some early gains off the table which is normal and natural during a bull market.)
Now let’s take it back to the top.
We are still in a long term bull market. But that doesn’t mean that gains will roll in every day, week or month.
There will be...and should be, painful periods of adjustment like this to remove excesses that pave the way for the next leg higher. That is what I expect to happen after the election and into 2025.
In the meantime, investors should perhaps have a dose of caution in their investment strategy. Still mostly long the stock market. But perhaps a more conservative mix that has an eye towards value like we always have thanks to the 31 value factors in the POWR Ratings stock selection model.
To appreciate what I am recommending now, then read on below.
What To Do Next?
Discover my current portfolio of 11 stocks packed to the brim with the outperforming benefits found in our exclusive POWR Ratings model. (Nearly 4X better than the S&P 500 going back to 1999).
On top of that we have created a hedge against looming downside with 2 unique ETFs.
All of these hand selected picks are all based on my 44 years of investing experience seeing bull markets...bear markets...and everything between.
And right now this portfolio is beating the stuffing out of the market.
If you are curious to learn more, and want to see all these timely 13 trades, then please click the link below to get started now.
Steve Reitmeister’s Trading Plan & Top 13 Picks >
Wishing you a world of investment success!

Steve Reitmeister…but everyone calls me Reity (pronounced “Righty”)
CEO, StockNews.com and Editor, Reitmeister Total Return
SPY shares fell $5.95 (-1.10%) in premarket trading Friday. Year-to-date, SPY has gained 14.97%, versus a % rise in the benchmark S&P 500 index during the same period.
About the Author: Steve Reitmeister

Steve is better known to the StockNews audience as “Reity”. Not only is he the CEO of the firm, but he also shares his 40 years of investment experience in the Reitmeister Total Return portfolio. Learn more about Reity’s background, along with links to his most recent articles and stock picks.
The post How Low Can Stocks Go? appeared first on StockNews.com