

Life sciences company Neogen (NASDAQ: NEOG) reported Q2 CY2025 results beating Wall Street’s revenue expectations, but sales fell by 4.8% year on year to $225.5 million. The company’s full-year revenue guidance of $830 million at the midpoint came in 3.4% above analysts’ estimates. Its non-GAAP profit of $0.05 per share was 44.4% below analysts’ consensus estimates.
Is now the time to buy Neogen? Find out by accessing our full research report, it’s free.
Neogen (NEOG) Q2 CY2025 Highlights:
- Revenue: $225.5 million vs analyst estimates of $222.5 million (4.8% year-on-year decline, 1.3% beat)
- Adjusted EPS: $0.05 vs analyst expectations of $0.09 (44.4% miss)
- Adjusted EBITDA: $40.62 million vs analyst estimates of $40.8 million (18% margin, in line)
- EBITDA guidance for the upcoming financial year 2026 is $170 million at the midpoint, above analyst estimates of $162.8 million
- Operating Margin: -271%, down from 5.5% in the same quarter last year due largely to ~$600 million non-cash goodwill impairment charge related primarily to the acquisition of the former 3M Food Safety Division
- Free Cash Flow Margin: 0.2%, similar to the same quarter last year
- Market Capitalization: $1.18 billion
“The softer end-market conditions continued in the fourth quarter, with elevated trade uncertainty and the cumulative effect of the last four years of inflation on food production,” said John Adent, Neogen’s President and Chief Executive Officer.
Company Overview
Founded in 1981 and operating at the intersection of food safety and animal health, Neogen (NASDAQ: NEOG) develops and manufactures diagnostic tests and related products to detect dangerous substances in food and pharmaceuticals for animal health.
Revenue Growth
Examining a company’s long-term performance can provide clues about its quality. Any business can have short-term success, but a top-tier one grows for years. Luckily, Neogen’s sales grew at a solid 16.4% compounded annual growth rate over the last five years. Its growth beat the average healthcare company and shows its offerings resonate with customers.
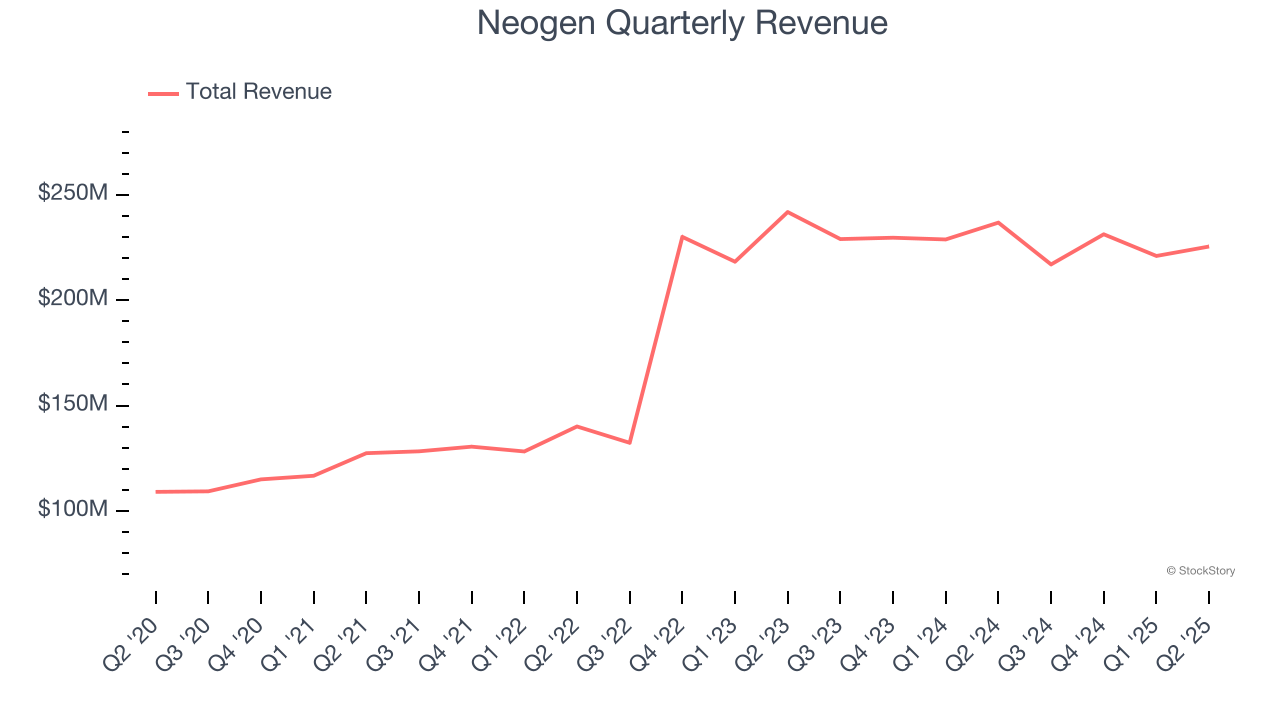
Long-term growth is the most important, but within healthcare, a half-decade historical view may miss new innovations or demand cycles. Neogen’s recent performance shows its demand has slowed as its annualized revenue growth of 4.3% over the last two years was below its five-year trend. 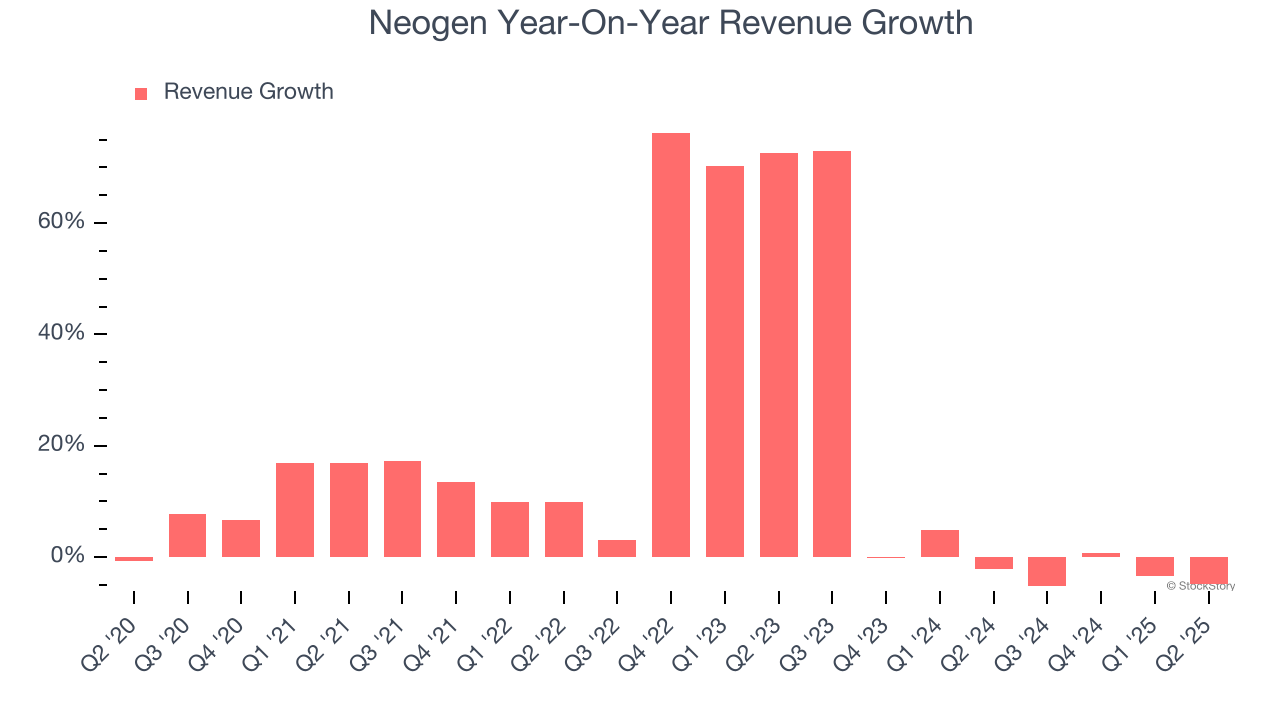
This quarter, Neogen’s revenue fell by 4.8% year on year to $225.5 million but beat Wall Street’s estimates by 1.3%.
Looking ahead, sell-side analysts expect revenue to decline by 10.2% over the next 12 months, a deceleration versus the last two years. This projection is underwhelming and implies its products and services will face some demand challenges.
Software is eating the world and there is virtually no industry left that has been untouched by it. That drives increasing demand for tools helping software developers do their jobs, whether it be monitoring critical cloud infrastructure, integrating audio and video functionality, or ensuring smooth content streaming. Click here to access a free report on our 3 favorite stocks to play this generational megatrend.
Operating Margin
Operating margin is a key measure of profitability. Think of it as net income - the bottom line - excluding the impact of taxes and interest on debt, which are less connected to business fundamentals.
Neogen’s high expenses have contributed to an average operating margin of negative 22.9% over the last five years. Unprofitable healthcare companies require extra attention because they could get caught swimming naked when the tide goes out. It’s hard to trust that the business can endure a full cycle.
Analyzing the trend in its profitability, Neogen’s operating margin decreased significantly over the last five years. The company’s two-year trajectory also shows it failed to get its profitability back to the peak as its margin fell by 123.2 percentage points. This performance was poor no matter how you look at it - it shows its expenses were rising and it couldn’t pass those costs onto its customers.
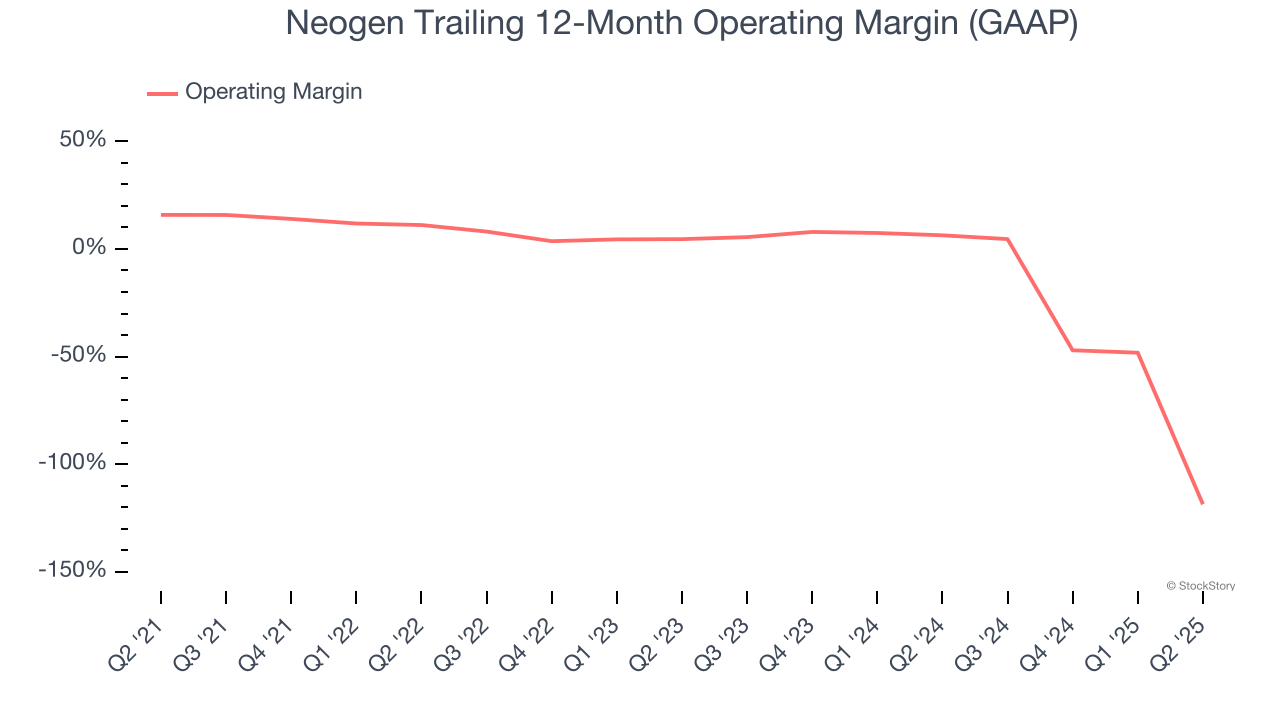
This quarter, Neogen generated a negative 271% operating margin due largely to ~$600 million non-cash goodwill impairment charge related primarily to the acquisition of the former 3M Food Safety Division.
Earnings Per Share
Revenue trends explain a company’s historical growth, but the long-term change in earnings per share (EPS) points to the profitability of that growth – for example, a company could inflate its sales through excessive spending on advertising and promotions.
Sadly for Neogen, its EPS declined by 10.2% annually over the last five years while its revenue grew by 16.4%. This tells us the company became less profitable on a per-share basis as it expanded.
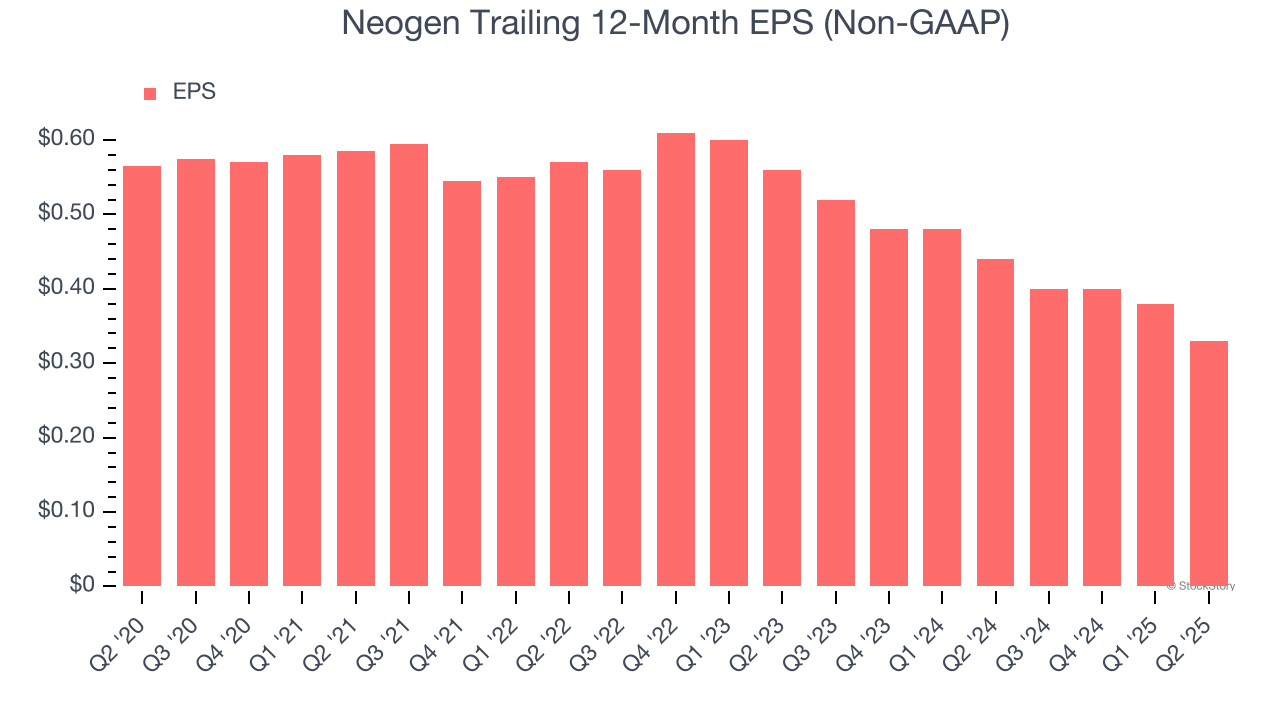
Diving into the nuances of Neogen’s earnings can give us a better understanding of its performance. As we mentioned earlier, Neogen’s operating margin declined by 134.4 percentage points over the last five years. Its share count also grew by 104%, meaning the company not only became less efficient with its operating expenses but also diluted its shareholders. 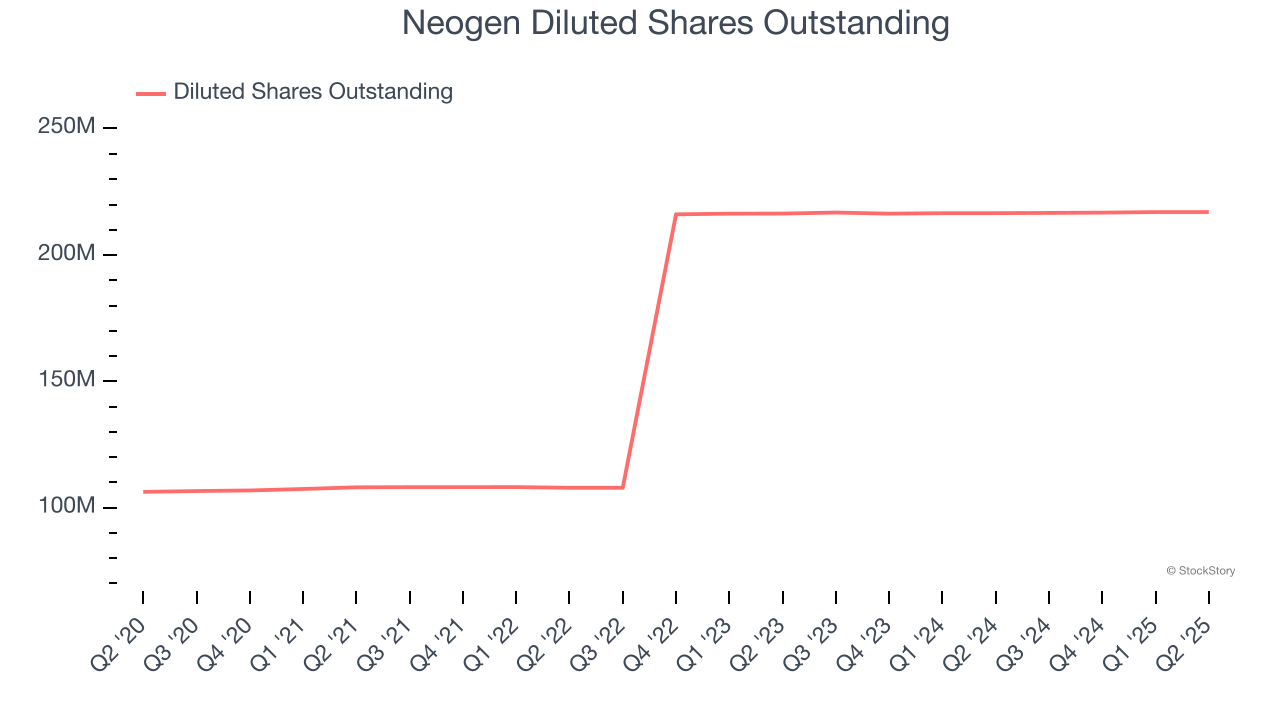
In Q2, Neogen reported EPS at $0.05, down from $0.10 in the same quarter last year. This print missed analysts’ estimates. Over the next 12 months, Wall Street expects Neogen to perform poorly. Analysts forecast its full-year EPS of $0.33 will hit $0.37.
Key Takeaways from Neogen’s Q2 Results
We were impressed by Neogen’s optimistic full-year revenue guidance, which exceeded analysts’ expectations. On the other hand, its adjusted EPS missed. Overall, this print was mixed. Investors were likely hoping for more, and shares traded down 2.7% to $5.28 immediately after reporting.
Big picture, is Neogen a buy here and now? When making that decision, it’s important to consider its valuation, business qualities, as well as what has happened in the latest quarter. We cover that in our actionable full research report which you can read here, it’s free.


