OLED provider Universal Display (NASDAQ: OLED) missed Wall Street’s revenue expectations in Q1 CY2026, with sales falling 14.5% year on year to $142.2 million. The company’s full-year revenue guidance of $650 million at the midpoint came in 3.5% below analysts’ estimates. Its GAAP profit of $0.76 per share was 34% below analysts’ consensus estimates.
Is now the time to buy Universal Display? Find out by accessing our full research report, it’s free.
Universal Display (OLED) Q1 CY2026 Highlights:
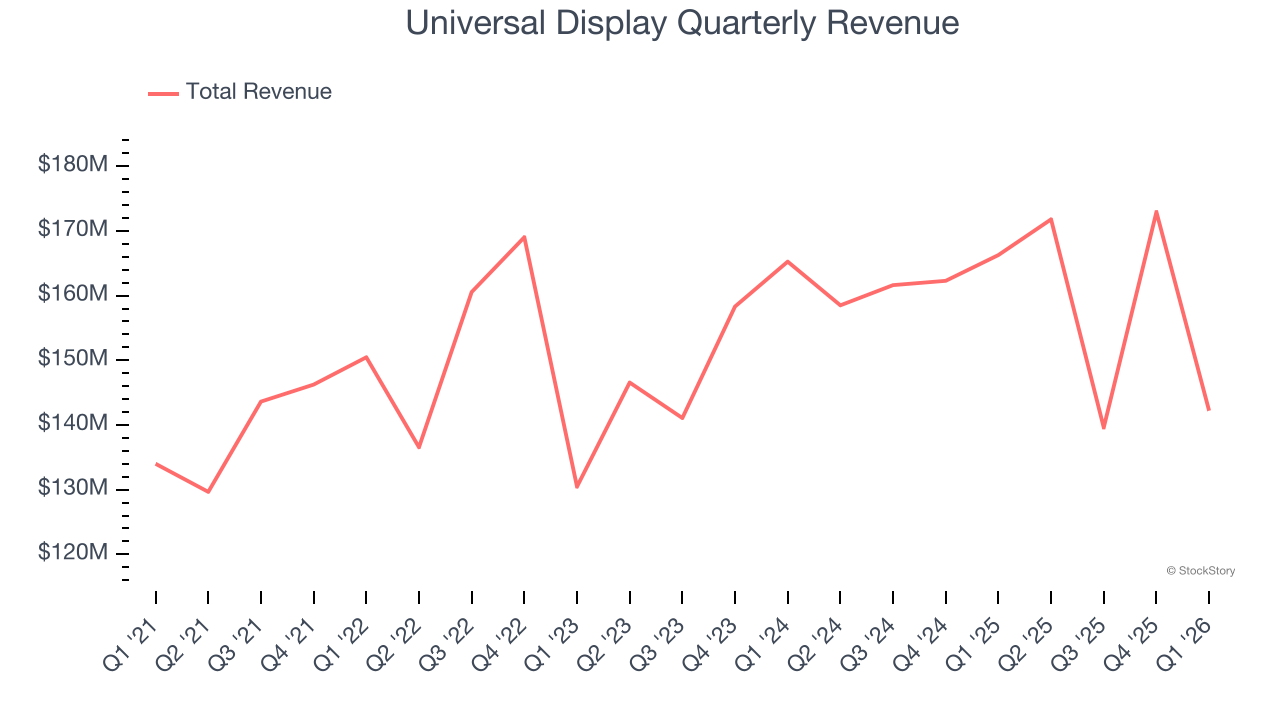
- Revenue: $142.2 million vs analyst estimates of $159.8 million (14.5% year-on-year decline, 11% miss)
- EPS (GAAP): $0.76 vs analyst expectations of $1.15 (34% miss)
- Adjusted Operating Income: $50.31 million vs analyst estimates of $58.5 million (35.4% margin, 14% miss)
- The company dropped its revenue guidance for the full year to $650 million at the midpoint from $675 million, a 3.7% decrease
- Operating Margin: 30.1%, down from 41.9% in the same quarter last year
- Free Cash Flow Margin: 70.5%, up from 10.5% in the same quarter last year
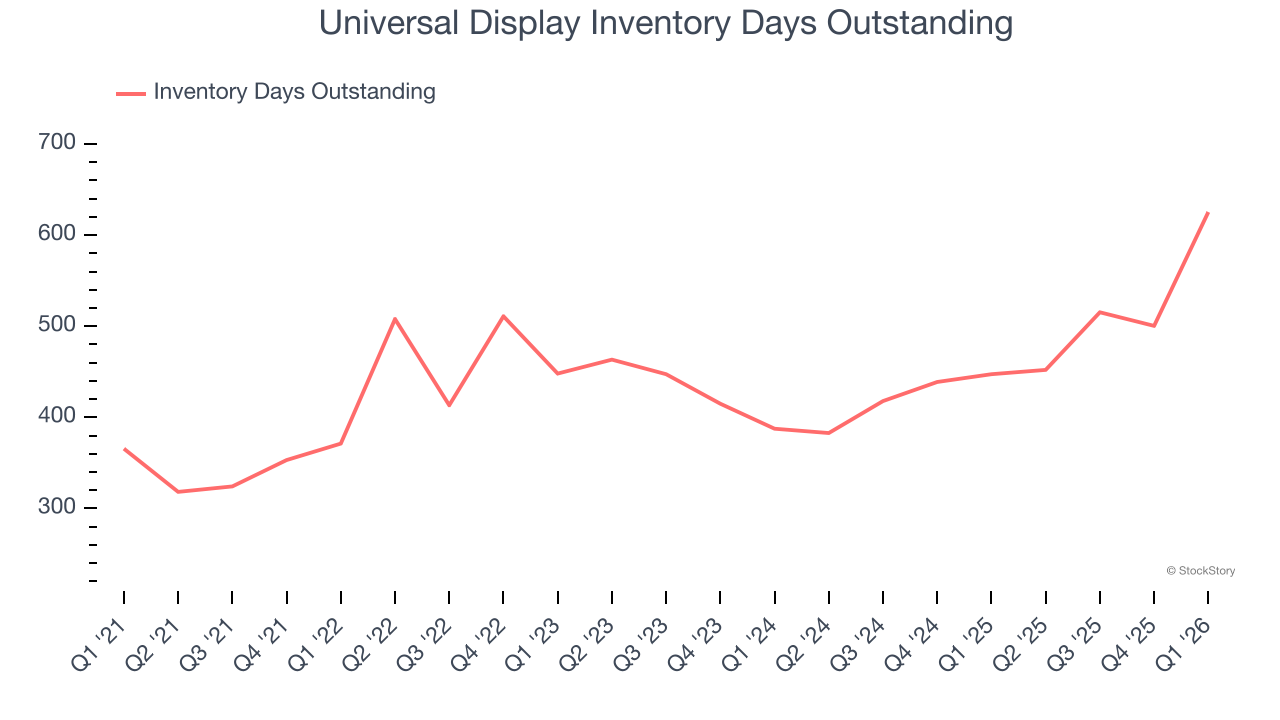
- Inventory Days Outstanding: 625, up from 500 in the previous quarter
- Market Capitalization: $4.19 billion
Company Overview
Serving major consumer electronics manufacturers, Universal Display (NASDAQ: OLED) is a provider of organic light emitting diode (OLED) technologies used in display and lighting applications.
Revenue Growth
Reviewing a company’s long-term sales performance reveals insights into its quality. Even a bad business can shine for one or two quarters, but a top-tier one grows for years. Thankfully, Universal Display’s 6.8% annualized revenue growth over the last five years was decent. Its growth was slightly above the average semiconductor company and shows its offerings resonate with customers. Semiconductors are a cyclical industry, and long-term investors should be prepared for periods of high growth followed by periods of revenue contractions.
Long-term growth is the most important, but short-term results matter for semiconductors because the rapid pace of technological innovation (Moore's Law) could make yesterday's hit product obsolete today. Universal Display’s recent performance shows its demand has slowed as its annualized revenue growth of 1.2% over the last two years was below its five-year trend. We’re wary when companies in the sector see decelerations in revenue growth, as it could signal changing consumer tastes aided by low switching costs. 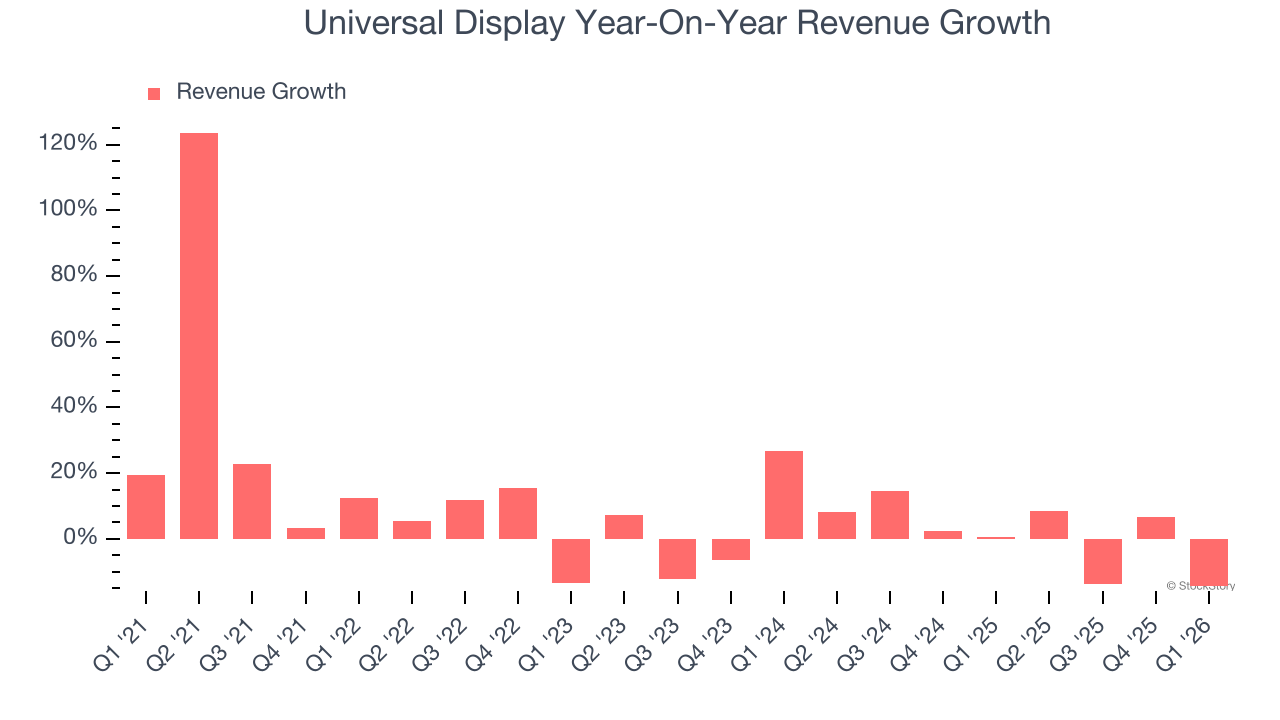
This quarter, Universal Display missed Wall Street’s estimates and reported a rather uninspiring 14.5% year-on-year revenue decline, generating $142.2 million of revenue.
Looking ahead, sell-side analysts expect revenue to grow 9.4% over the next 12 months. Although this projection implies its newer products and services will fuel better top-line performance, it is still below average for the sector.
ONE MORE THING: The $21 AI Application Stock Wall Street Forgot. While Wall Street obsesses over who’s building AI, one company is already using it to print money. And nobody’s paying attention.
AI chip stocks trade at ridiculous valuations. This company processes a trillion consumer signals monthly using AI and trades at a third of the price. The gap won’t last. The institutions will figure it out. You need to see this first. Read the FREE Report Before They Notice.
Product Demand & Outstanding Inventory
Days Inventory Outstanding (DIO) is an important metric for chipmakers, as it reflects a business’ capital intensity and the cyclical nature of semiconductor supply and demand. In a tight supply environment, inventories tend to be stable, allowing chipmakers to exert pricing power. Steadily increasing DIO can be a warning sign that demand is weak, and if inventories continue to rise, the company may have to downsize production.
This quarter, Universal Display’s DIO came in at 625, which is 188 days above its five-year average, suggesting that the company’s inventory has grown to higher levels than we’ve seen in the past.
Key Takeaways from Universal Display’s Q1 Results
We struggled to find many positives in these results. Its full-year revenue guidance missed and its full-year revenue guidance was downgraded. Overall, this was a weaker quarter. The stock remained flat at $90.97 immediately after reporting.
So do we think Universal Display is an attractive buy at the current price? If you’re making that decision, you should consider the bigger picture of valuation, business qualities, as well as the latest earnings. We cover that in our actionable full research report which you can read here (it’s free).