ETFOptimize | High-performance ETF-based Investment Strategies

Quantitative strategies, Wall Street-caliber research, and insightful market analysis since 1998.


ETFOptimize | HOME
Close Window

Are Wall Street Analysts Predicting Realty Income Stock Will Climb or Sink?

Realty Income Corporation (O), headquartered in San Diego, California, is a real estate partner to the world's leading companies. With a market cap of $52.9 billion, the company owns and manages a portfolio of commercial properties located across the U.S. Realty Income focuses on acquiring single-tenant retail locations, leased to regional and national chains, and under long-term net lease agreements.

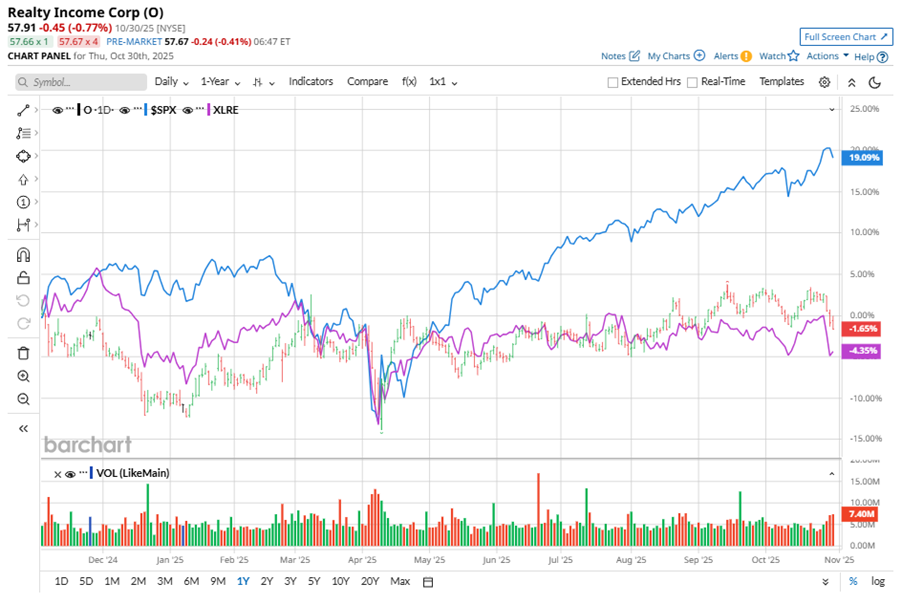
Shares of this REIT giant have underperformed the broader market considerably over the past year. O has declined 4.3% over this time frame, while the broader S&P 500 Index ($SPX) has rallied nearly 17.4%. In 2025, O stock is up 8.4%, compared to the SPX’s 16% gains on a YTD basis. 


Narrowing the focus, O’s outperformance is apparent compared to the Real Estate Select Sector SPDR Fund (XLRE). The exchange-traded fund has declined about 7% over the past year. Moreover, O’s single-digit returns on a YTD basis outshine the ETF’s marginal gains over the same time frame.

www.barchart.com

On Aug. 6, Realty Income posted mixed Q2 results, with shares closing slightly higher in the subsequent trading session. The company's AFFO per share of $1.05 was down marginally from the year-ago quarter and missed estimates. However, revenue rose 5.3% year-over-year to $1.4 billion, beating analyst expectations. This revenue outperformance likely offset concerns over AFFO, resulting in a slight increase in share price. 

For the current fiscal year, ending in December, analysts expect O’s FFO per share to grow 1.9% to $4.27 on a diluted basis. The company’s FFO surprise history is mixed. It matched the consensus estimate in two of the last four quarters while missing the forecast on two other occasions.

Among the 25 analysts covering O stock, the consensus is a “Hold.” That’s based on four “Strong Buy” ratings, one “Moderate Buy,” and 20 “Holds.”

www.barchart.com

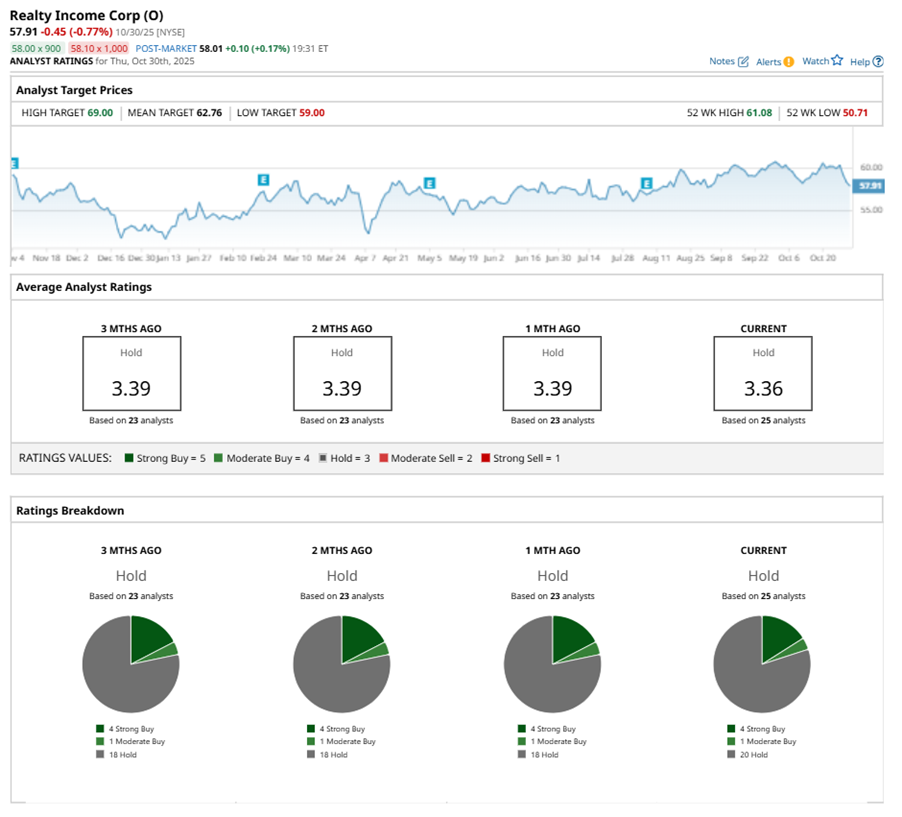
The configuration has been reasonably stable over the past three months.

On Oct. 28, Ronald Kamdem from Morgan Stanley (MS) maintained a “Hold’ rating on O with a price target of $62, implying a potential upside of 7.1% from current levels.

The mean price target of $62.76 represents an 8.4% premium to O’s current price levels. The Street-high price target of $69 suggests an upside potential of 19.2%. 


On the date of publication, Neha Panjwani did not have (either directly or indirectly) positions in any of the securities mentioned in this article. All information and data in this article is solely for informational purposes. For more information please view the Barchart Disclosure Policy here.


More news from Barchart

Recent Quotes

View More
Symbol Price Change (%)
AMZN  244.22
+21.36 (9.58%)
AAPL  270.37
-1.03 (-0.38%)
AMD  256.12
+1.28 (0.50%)
BAC  53.45
+0.42 (0.79%)
GOOG  281.82
-0.08 (-0.03%)
META  648.35
-18.12 (-2.72%)
MSFT  517.81
-7.95 (-1.51%)
NVDA  202.49
-0.40 (-0.20%)
ORCL  262.61
+5.72 (2.23%)
TSLA  456.56
+16.46 (3.74%)
Stock Quote API & Stock News API supplied by www.cloudquote.io
Quotes delayed at least 20 minutes.
By accessing this page, you agree to the Privacy Policy and Terms Of Service.


IntelligentValue Home
Close Window

DISCLAIMER

All content herein is issued solely for informational purposes and is not to be construed as an offer to sell or the solicitation of an offer to buy, nor should it be interpreted as a recommendation to buy, hold or sell (short or otherwise) any security.  All opinions, analyses, and information included herein are based on sources believed to be reliable, but no representation or warranty of any kind, expressed or implied, is made including but not limited to any representation or warranty concerning accuracy, completeness, correctness, timeliness or appropriateness. We undertake no obligation to update such opinions, analysis or information. You should independently verify all information contained on this website. Some information is based on analysis of past performance or hypothetical performance results, which have inherent limitations. We make no representation that any particular equity or strategy will or is likely to achieve profits or losses similar to those shown. Shareholders, employees, writers, contractors, and affiliates associated with ETFOptimize.com may have ownership positions in the securities that are mentioned. If you are not sure if ETFs, algorithmic investing, or a particular investment is right for you, you are urged to consult with a Registered Investment Advisor (RIA). Neither this website nor anyone associated with producing its content are Registered Investment Advisors, and no attempt is made herein to substitute for personalized, professional investment advice. Neither ETFOptimize.com, Global Alpha Investments, Inc., nor its employees, service providers, associates, or affiliates are responsible for any investment losses you may incur as a result of using the information provided herein. Remember that past investment returns may not be indicative of future returns.

Copyright © 1998-2017 ETFOptimize.com, a publication of Optimized Investments, Inc. All rights reserved.