"Sugar #11" refers to the global benchmark futures contract for raw sugar traded on the ICE Futures U.S. exchange. The actual planting and harvesting seasons for physical sugar (sugarcane) vary throughout the year across the major producing countries, most notably Brazil, India, and Thailand, helping ensure a continuous global supply.
Planting and Harvesting Seasons by Region
Sugarcane is a tropical and subtropical crop that generally grows for at least 12 months before harvest. The specific timing varies by hemisphere and local climate:
| Country/Region | Hemisphere | Planting Season | Harvesting Season (Milling Season) |
| Brazil (Center-South) | Southern | August–September and February–April (depending on moisture) | April to March (peak is generally April to October/November) |
| India | Northern | Autumn (Sept-Oct), Spring (Feb-Mar), and Summer (Apr-May) | Generally, October/November through April |
| Thailand | Northern | May–June (planting with the rainy season) | Generally, November through April |
| USA (Florida/Louisiana) | Northern | August-October (fall planting) | Mid-October to mid-March |
| Australia | Southern | August–October (planting using setts) | June to December |
Sugar #11 Futures Contract Months
The physical sugar associated with the Sugar #11 contract is delivered in specific contract months, which are spaced throughout the year to align with global supply flows:
- March (H)
- May (K)
- July (N)
- October (V)
This contract structure allows participants in the global market to manage price risks related to the continuous, year-round cycle of planting and harvesting across different regions.
Sugar #11 traders know the contract reflects a year-round global supply chain, but the real price pressure hits when the big three—Brazil, India, and Thailand—dump their crops at once. Brazil's Center-South cranks from April through November, India fires up mills in October/November, and Thailand follows right behind with harvests running from November to April; that overlap means a wall of raw sugar floods the pipeline every October-November as these giants wrap their cycles. The consistent 12-month cane growth and fixed planting windows lock in this high-supply window like clockwork, creating a reliable seasonal sell pattern you can lean on—macro supply, not guesswork, drives the October and November contracts lower almost every year.
Technical Picture for Sugar #11
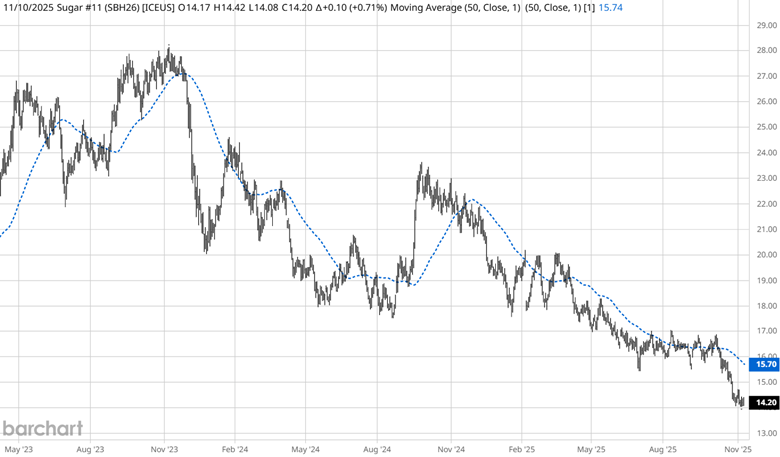
Source: Barchart
Since sugar prices peaked in November 2023, the 50-day simple moving average (SMA) has held up well, keeping the downtrend intact. Prices may need to return towards the mean (SMA) to alleviate some of the oversold conditions in the current price drop. Sugar is showing no technical or fundamental signs that prices are bottoming.
March Sugar Futures Contract Correlations

The bearish downtrend has a significant 6-year correlation (green) to previous years with similar downtrends: 1965 (88%), 1967 (91%), 1982 (86%), 1983 (86%), 1991 (86%), and 1999 (85%). Currently, the March sugar futures are basing sideways, in sync with the correlation. Towards the end of November, it appears sugar prices have historically come under more selling pressure, which could carry into the year-end.
Seasonal Pattern
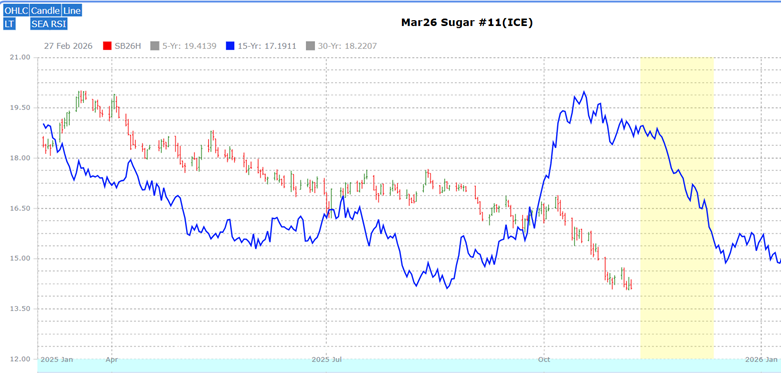
Source: Moore Research Center Inc. (MRCI)
MRCI research has found that March sugar prices have peaked in the latter part of the global harvest season, when supply is at its highest. The 15-year pattern (blue) shows a price peak in mid-October, but the seasonal sell window (yellow), which has the lowest drawdown for a move, shows that sugar prices have closed lower on approximately Dec 12 than on Nov 11. Through hypothetical testing, the results have shown that this occurrence has occurred 14 of the past 15 years, a 93% rate. The average net profit was 1.03 points ($1,155). Due to the consistency of the planting and harvesting seasons, this trade has had 5 years without daily closing drawdowns over the past 15 years.

Source: MRCI
As a crucial reminder, while seasonal patterns can provide valuable insights, they should not be the basis for trading decisions. Traders must consider various technical and fundamental indicators, risk management strategies, and market conditions to make informed, balanced trading decisions.
Products to Trade Sugar
Readers looking to participate in the sugar market have several options:
- The primary vehicle is the Sugar #11 futures contract (SB), traded on ICE, representing 112,000 pounds of raw cane sugar, quoted in U.S. cents per pound. Each 0.01 cent move equals $11.20 per contract.
- Options on Sugar #11 futures offer another way to speculate or hedge, allowing traders to limit risk while targeting price movements.
- For those preferring equity accounts, the Teucrium Sugar Fund (CANE) provides unleveraged exposure to sugar prices through an ETF, designed to minimize the impact of contango and backwardation by avoiding front-month contracts.
In Closing…
The seasonal sell in Sugar #11 isn't some vague chart wiggle—it's tied to Brazil, India, and Thailand, all crushing cane and dumping supply starting October into November, year after year, because cane takes 12 months to grow and planting windows don't move. MRCI's 15-year data backs it: March contracts close lower around Dec 12 than Nov 11 in 14 of 15 years, with a 93% hit rate and average profit of 1.03 points ($1,155), and 5 of those years had zero daily closing drawdowns. That's macro supply, not noise.
The technicals line up too—the 50-day SMA has capped rallies since the 2023 top, and the current 6-year correlation to prior bear markets (85-91%) shows prices basing now but historically cracking hard into year-end. No bottom signals yet. Trade it with SB futures, options, or CANE in equity accounts, but size right and watch the SMA—more supply coming, and the pattern's proven it pays to fade the bounce.
On the date of publication, Don Dawson did not have (either directly or indirectly) positions in any of the securities mentioned in this article. All information and data in this article is solely for informational purposes. For more information please view the Barchart Disclosure Policy here.
More news from Barchart
- Airbnb Keeps Generating Strong FCF and FCF Margins and Could Be 15% -20% Too Cheap
- Despite an Earnings Miss, Super Micro Computer’s (SMCI) Options Flow Points to a Potential Reversal
- Global Sugar Supply Peaks Near Mid-October: SB Drops 14/15 Years. Are You Trading the Macro or the Noise?
- Option Volatility and Earnings Report for November 10 - 14