ETFOptimize | High-performance ETF-based Investment Strategies

Quantitative strategies, Wall Street-caliber research, and insightful market analysis since 1998.


ETFOptimize | HOME
Close Window

Do Wall Street Analysts Like Lennox International Stock?

Lennox International Inc. (LII) is a manufacturer and marketer of heating, ventilation, air-conditioning and refrigeration (HVACR) systems for residential and commercial uses. Headquartered in Richardson, Texas, the company designs, manufactures and sells a broad range of products, including furnaces, heat pumps, air-conditioners, packaged systems, indoor-air-quality equipment and related services under brands such as Lennox, Armstrong Air, Bohn, ADP and others. The company’s market capitalization is around $17.2 billion.

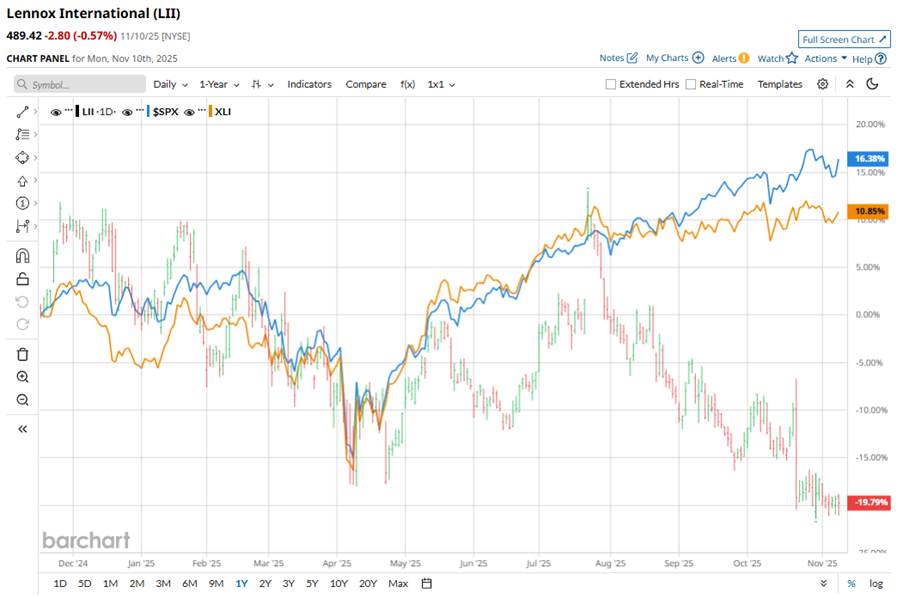
Shares of Lennox International have underperformed the broader market. Over the past 52 weeks, LII has declined 22.4%, while the broader S&P 500 Index ($SPX) has rallied nearly 14% over the same time frame. In 2025, LII stock is down 19.7%, compared to the SPX’s 16.2% rise on a YTD basis. 


Narrowing the focus, LII’s underperformance is also apparent compared to the Industrial Select Sector SPDR Fund (XLI), which has gained about 8.5% over the past year. Moreover, the ETF’s 17% gains on a YTD basis outpaced LII. 

www.barchart.com

Investors are growing cautious because demand in the residential heating, ventilation and air-conditioning industry has softened. For example, the company noted that its industry shipments have declined for many months, a sign that its core business is facing cyclical headwinds. 

At the same time, some major analysts trimmed their price targets and expressed concerns about regulatory/tariff exposure and slower market momentum, which tends to dampen investor sentiment.

For the current fiscal year, ending in December, analysts expect Lennox International’s EPS to grow 1.8% to $22.99. The company’s earnings surprise history is impressive. It beat the consensus estimate in each of the last four quarters.

Wall Street’s take on LII is pretty balanced – neither overly bullish nor bearish. Among the 19 analysts covering the stock, the consensus is a “Hold.” That’s based on six “Strong Buy” ratings, 10 “Holds,” one “Moderate Sell,” and two “Strong Sells.”

www.barchart.com

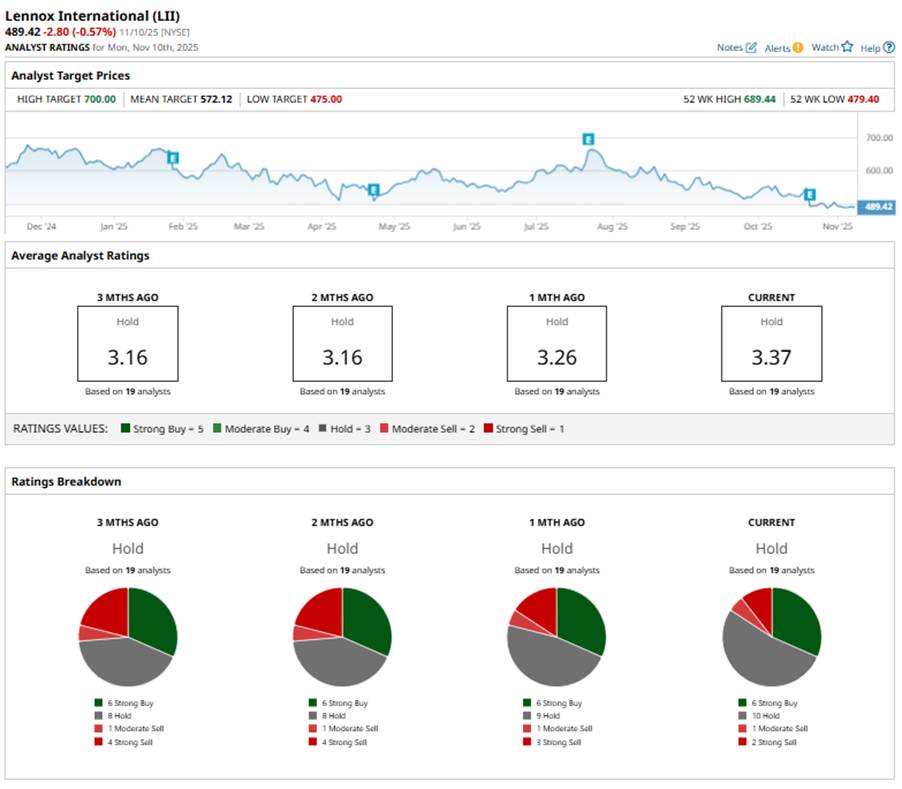
This configuration is slightly less bearish than two months ago, when there were four “Strong Sell” ratings. 

Last month, UBS lowered its price target on LII to $560 from $610, maintaining a “Neutral” rating, citing weaker near-term demand and free cash flow headwinds.

The mean price target of $572.12 represents a 16.9% premium to LII’s current price levels. The Street-high price target of $700 suggests an ambitious upside potential of 43%.


On the date of publication, Sristi Jayaswal did not have (either directly or indirectly) positions in any of the securities mentioned in this article. All information and data in this article is solely for informational purposes. For more information please view the Barchart Disclosure Policy here.


More news from Barchart

Recent Quotes

View More
Symbol Price Change (%)
AMZN  244.86
-4.24 (-1.70%)
AAPL  274.69
-0.56 (-0.20%)
AMD  261.04
+23.52 (9.90%)
BAC  54.34
+0.71 (1.33%)
GOOG  285.59
-6.15 (-2.11%)
META  610.07
-17.01 (-2.71%)
MSFT  501.05
-7.63 (-1.50%)
NVDA  192.93
-0.23 (-0.12%)
ORCL  228.52
-7.63 (-3.23%)
TSLA  429.17
-10.45 (-2.38%)
Stock Quote API & Stock News API supplied by www.cloudquote.io
Quotes delayed at least 20 minutes.
By accessing this page, you agree to the Privacy Policy and Terms Of Service.


IntelligentValue Home
Close Window

DISCLAIMER

All content herein is issued solely for informational purposes and is not to be construed as an offer to sell or the solicitation of an offer to buy, nor should it be interpreted as a recommendation to buy, hold or sell (short or otherwise) any security.  All opinions, analyses, and information included herein are based on sources believed to be reliable, but no representation or warranty of any kind, expressed or implied, is made including but not limited to any representation or warranty concerning accuracy, completeness, correctness, timeliness or appropriateness. We undertake no obligation to update such opinions, analysis or information. You should independently verify all information contained on this website. Some information is based on analysis of past performance or hypothetical performance results, which have inherent limitations. We make no representation that any particular equity or strategy will or is likely to achieve profits or losses similar to those shown. Shareholders, employees, writers, contractors, and affiliates associated with ETFOptimize.com may have ownership positions in the securities that are mentioned. If you are not sure if ETFs, algorithmic investing, or a particular investment is right for you, you are urged to consult with a Registered Investment Advisor (RIA). Neither this website nor anyone associated with producing its content are Registered Investment Advisors, and no attempt is made herein to substitute for personalized, professional investment advice. Neither ETFOptimize.com, Global Alpha Investments, Inc., nor its employees, service providers, associates, or affiliates are responsible for any investment losses you may incur as a result of using the information provided herein. Remember that past investment returns may not be indicative of future returns.

Copyright © 1998-2017 ETFOptimize.com, a publication of Optimized Investments, Inc. All rights reserved.