ETFOptimize | High-performance ETF-based Investment Strategies

Quantitative strategies, Wall Street-caliber research, and insightful market analysis since 1998.


ETFOptimize | HOME
Close Window

Williams Companies Stock Outlook: Is Wall Street Bullish or Bearish?

The Williams Companies, Inc. (WMB), headquartered in Tulsa, Oklahoma, operates as an energy infrastructure company focused on connecting North America's hydrocarbon resource plays to growing markets for natural gas, natural gas liquids (NGLs), and olefins. With a market cap of $68.9 billion, the company owns and operates midstream gathering and processing assets and interstate natural gas pipelines.

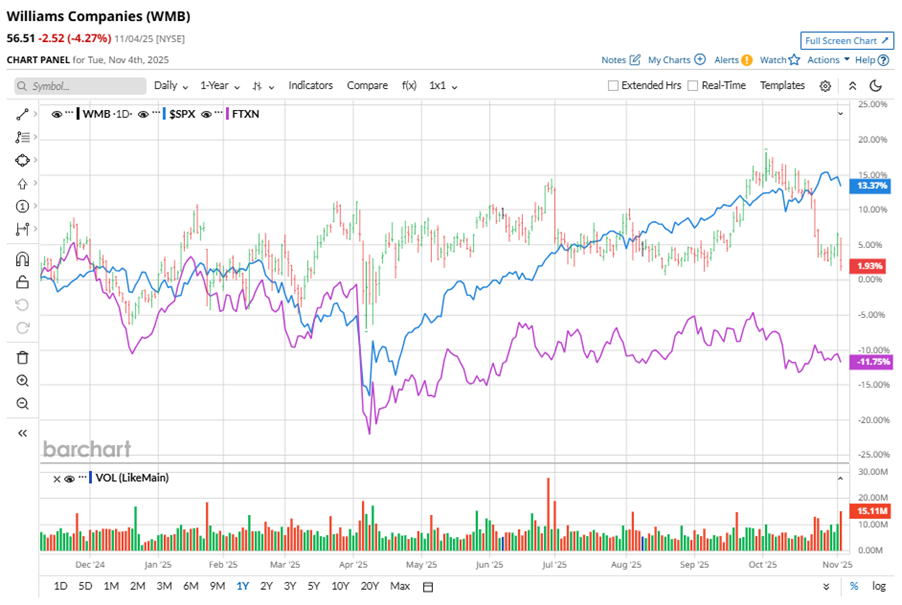
Shares of this natural gas giant have underperformed the broader market over the past year. WMB has gained 8.4% over this time frame, while the broader S&P 500 Index ($SPX) has rallied nearly 18.5%. In 2025, WMB stock is up 4.4%, compared to the SPX’s 15.1% rise on a YTD basis.


Narrowing the focus, WMB’s outperformance is apparent compared to the First Trust Nasdaq Oil & Gas ETF (FTXN). The exchange-traded fund has declined about 7.5% over the past year. Moreover, WMB’s returns on a YTD basis outshine the ETF’s 5.7% losses over the same time frame.

www.barchart.com

On Nov. 3, WMB shares closed up by 2% after reporting its Q3 results. Its adjusted EPS of $0.49 fell short of Wall Street expectations of $0.51. The company’s revenue was $2.9 billion, falling short of Wall Street forecasts of $3 billion. WMB expects full-year adjusted EPS in the range of $2.01 to $2.19.

For the current fiscal year, ending in December, analysts expect WMB’s EPS to grow 14.1% to $2.19 on a diluted basis. The company’s earnings surprise history is mixed. It beat the consensus estimate in two of the last four quarters while missing the forecast on two other occasions.

Among the 23 analysts covering WMB stock, the consensus is a “Moderate Buy.” That’s based on 13 “Strong Buy” ratings, two “Moderate Buys,” seven “Holds,” and one “Strong Sell.”

www.barchart.com

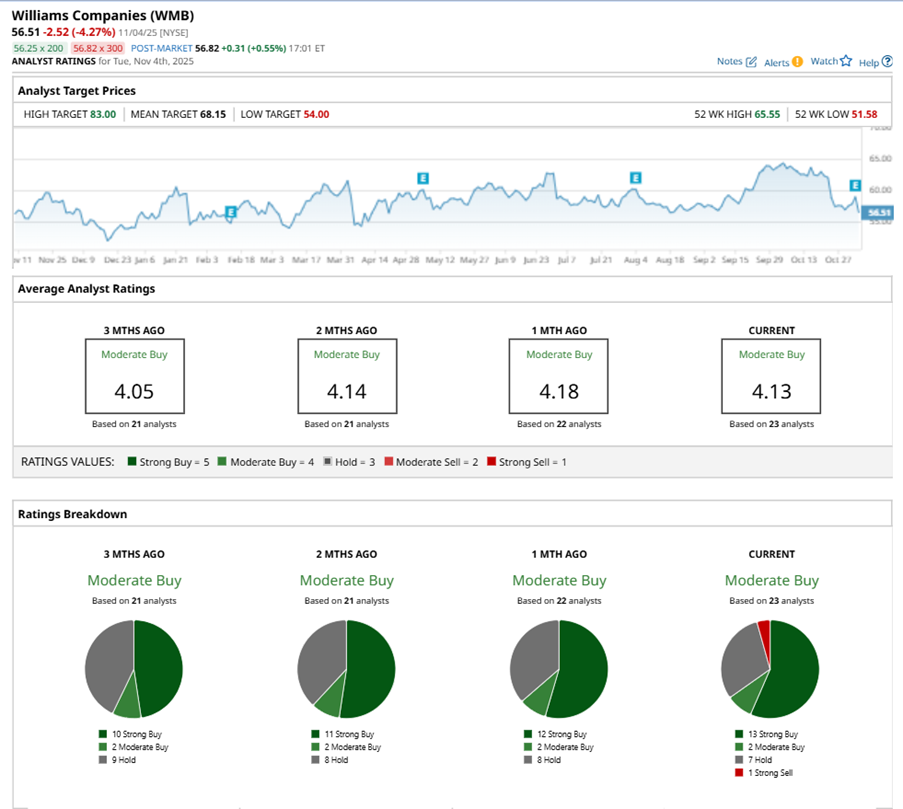
This configuration is more bullish than a month ago, with 12 analysts suggesting a “Strong Buy.”

On Oct. 27, Elvira Scotto from RBC Capital reiterated a “Buy” rating on WMB with a price target of $75, implying a potential upside of 32.7% from current levels.

The mean price target of $68.15 represents a 20.6% premium to WMB’s current price levels. The Street-high price target of $83 suggests an ambitious upside potential of 46.9%. 


On the date of publication, Neha Panjwani did not have (either directly or indirectly) positions in any of the securities mentioned in this article. All information and data in this article is solely for informational purposes. For more information please view the Barchart Disclosure Policy here.


More news from Barchart

Recent Quotes

View More
Symbol Price Change (%)
AMZN  245.69
-3.41 (-1.37%)
AAPL  275.07
-0.18 (-0.07%)
AMD  256.06
+18.54 (7.81%)
BAC  54.15
+0.52 (0.96%)
GOOG  286.98
-4.76 (-1.63%)
META  611.63
-15.45 (-2.46%)
MSFT  508.29
-0.39 (-0.08%)
NVDA  192.78
-0.38 (-0.20%)
ORCL  226.28
-9.87 (-4.18%)
TSLA  431.27
-8.35 (-1.90%)
Stock Quote API & Stock News API supplied by www.cloudquote.io
Quotes delayed at least 20 minutes.
By accessing this page, you agree to the Privacy Policy and Terms Of Service.


IntelligentValue Home
Close Window

DISCLAIMER

All content herein is issued solely for informational purposes and is not to be construed as an offer to sell or the solicitation of an offer to buy, nor should it be interpreted as a recommendation to buy, hold or sell (short or otherwise) any security.  All opinions, analyses, and information included herein are based on sources believed to be reliable, but no representation or warranty of any kind, expressed or implied, is made including but not limited to any representation or warranty concerning accuracy, completeness, correctness, timeliness or appropriateness. We undertake no obligation to update such opinions, analysis or information. You should independently verify all information contained on this website. Some information is based on analysis of past performance or hypothetical performance results, which have inherent limitations. We make no representation that any particular equity or strategy will or is likely to achieve profits or losses similar to those shown. Shareholders, employees, writers, contractors, and affiliates associated with ETFOptimize.com may have ownership positions in the securities that are mentioned. If you are not sure if ETFs, algorithmic investing, or a particular investment is right for you, you are urged to consult with a Registered Investment Advisor (RIA). Neither this website nor anyone associated with producing its content are Registered Investment Advisors, and no attempt is made herein to substitute for personalized, professional investment advice. Neither ETFOptimize.com, Global Alpha Investments, Inc., nor its employees, service providers, associates, or affiliates are responsible for any investment losses you may incur as a result of using the information provided herein. Remember that past investment returns may not be indicative of future returns.

Copyright © 1998-2017 ETFOptimize.com, a publication of Optimized Investments, Inc. All rights reserved.