The Williams Companies, Inc. (WMB) is a leading U.S. energy infrastructure company headquartered in Tulsa, Oklahoma. It primarily operates natural-gas pipelines and processing facilities, transporting and processing natural gas across the country. With a market cap of $74.4 billion, the company owns and operates midstream gathering and processing assets and interstate natural gas pipelines.
Companies worth $10 billion or more are generally described as “large-cap stocks,” and WMB perfectly fits that description, with its market cap exceeding this mark, underscoring its size, influence, and dominance within the oil & gas midstream industry. As a major midstream operator, Williams plays a key role in supplying natural gas for power generation, heating, and industrial use, with a business model that generates stable, fee-based revenue and lower exposure to commodity-price volatility.
Despite its notable strength, WMB slipped 6.3% from its 52-week high of $65.55, achieved on Oct. 2. Over the past three months, WMB stock surged 6.2%, outperforming the First Trust Nasdaq Oil & Gas ETF (FTXN), which has dropped marginally during the same time frame.
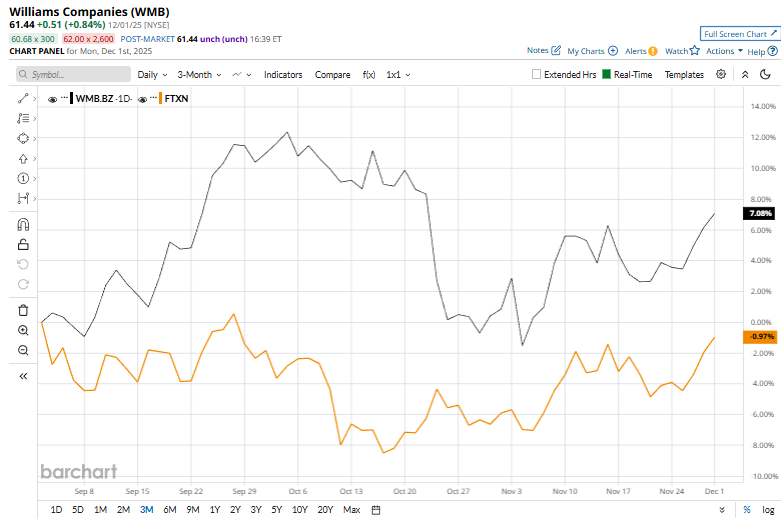
In the longer term, shares of WMB rose 13.5% on a YTD basis and 5% over the past 52 weeks, outperforming FTXN’s marginal YTD gain and a 9.3% drop over the last year.
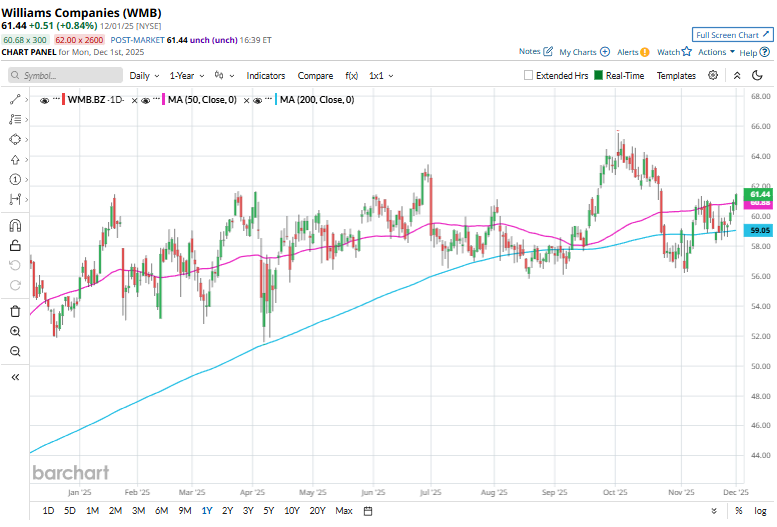
The stock has experienced some fluctuations recently and has climbed over the 200-moving average since early November and has remained below its 50-day moving average since late October.
WMB shares rose 2% on Nov. 3 following the release of its third-quarter results. Williams reported adjusted earnings of $0.49 per share, just shy of the $0.51 expected by analysts, while revenue totaled $2.9 billion, slightly below the $3 billion forecast. The company maintained its full-year guidance, projecting adjusted EPS between $2.01 and $2.19.
WMB’s rival, Kinder Morgan, Inc. (KMI) shares lagged behind the stock, with a marginal downtick on a YTD basis and a 3.5% drop over the past 52 weeks.
Wall Street analysts are reasonably bullish on WMB’s prospects. The stock has a consensus “Moderate Buy” rating from the 22 analysts covering it, and the mean price target of $68.75 suggests a potential upside of 11.9% from current price levels.
On the date of publication, Kritika Sarmah did not have (either directly or indirectly) positions in any of the securities mentioned in this article. All information and data in this article is solely for informational purposes. For more information please view the Barchart Disclosure Policy here.
More news from Barchart
- This Options Strategy Turns Your Stock Portfolio Into a Consistent Income Generator
- This ‘Strong Buy’ Dividend Stock Looks Set to Raise Payouts. Should You Buy Shares Now?
- JPMorgan Just Upgraded CleanSpark Stock. Should You Buy Shares Here?
- Dear Walmart Stock Fans, Mark Your Calendars for December 9