With a market cap of around $29 billion, Chandler, Arizona-based Microchip Technology Incorporated (MCHP) is a leading provider of smart, connected, and secure embedded control solutions, serving markets across the Americas, Europe, and Asia. It develops and manufactures microcontrollers, analog and interface products, and memory solutions for embedded systems.
Companies worth more than $10 billion are generally labeled as “large-cap” stocks and Microchip Technology fits this criterion perfectly. Its diverse product portfolio includes 8-bit, 16-bit, and 32-bit microcontrollers, mixed-signal processors, field-programmable gate arrays (FPGAs), and power management solutions. The company serves industries like automotive, industrial, computing, and communications.
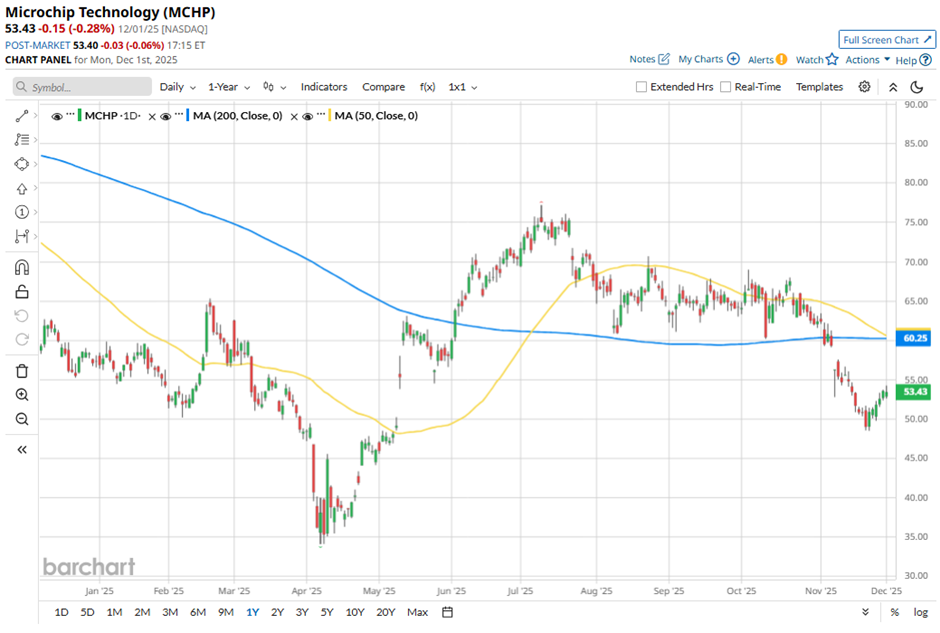
MCHP stock has dipped 30.8% from its 52-week high of $77.20. The chipmaker stock has declined 17.8% over the past three months, lagging behind the broader Dow Jones Industrials Average's ($DOWI) 3.8% rise during the same period.
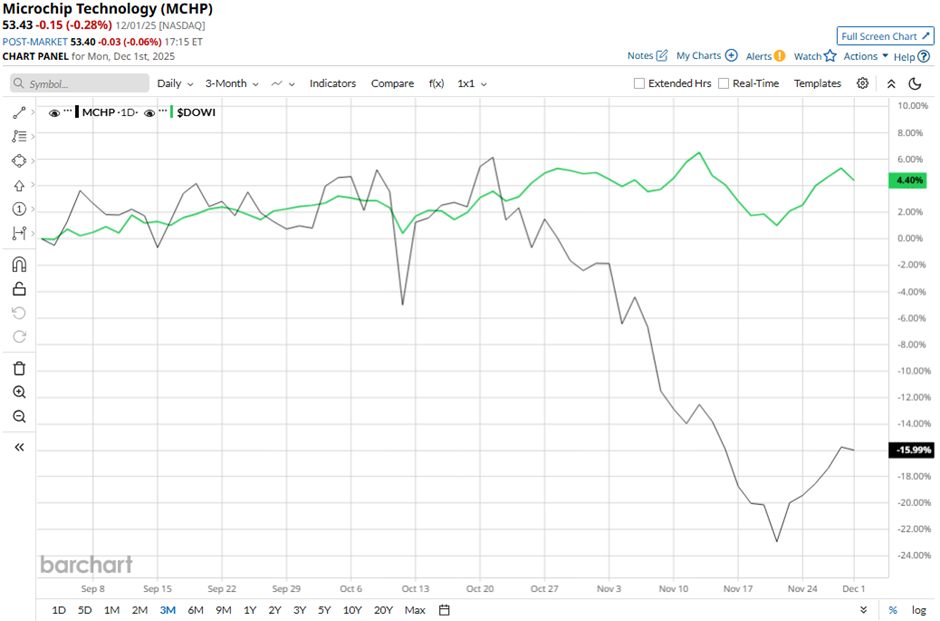
In the longer term, Microchip Technology's shares have decreased 6.8% on a YTD basis, underperforming DOWI’s 11.2% increase. Over the past 52 weeks, the stock has fallen 21.6%, compared to DOWI's 5.3% return over the same period.
MCHP stock has been trading below its 50-day moving average since August.
Despite reporting better-than-expected Q2 2026 adjusted EPS of $0.35 and revenue of $1.14 billion on Nov. 6, shares of MCHP tumbled 5.2% the next day because the company issued weak Q3 guidance, projecting net sales of $1.11 billion - $1.15 billion. It also forecast Q3 adjusted EPS of $0.34 - $0.40, with the midpoint falling below the expectations. Additionally, Microchip cited tepid automotive and industrial demand as customers continue to work down excess inventory, raising concerns about a slower recovery.
In comparison, rival NVIDIA Corporation (NVDA) has outperformed MCHP stock. NVIDIA stock has climbed nearly 34% YTD and 30.1% over the past 52 weeks.
Despite MCHP's weak performance, analysts are moderately optimistic about the stock's prospects. The stock has a consensus rating of “Moderate Buy” from the 25 analysts covering it, and the mean price target of $74.21 is a premium of 38.9% to current levels.
On the date of publication, Sohini Mondal did not have (either directly or indirectly) positions in any of the securities mentioned in this article. All information and data in this article is solely for informational purposes. For more information please view the Barchart Disclosure Policy here.
More news from Barchart
- This Options Strategy Turns Your Stock Portfolio Into a Consistent Income Generator
- This ‘Strong Buy’ Dividend Stock Looks Set to Raise Payouts. Should You Buy Shares Now?
- JPMorgan Just Upgraded CleanSpark Stock. Should You Buy Shares Here?
- Dear Walmart Stock Fans, Mark Your Calendars for December 9