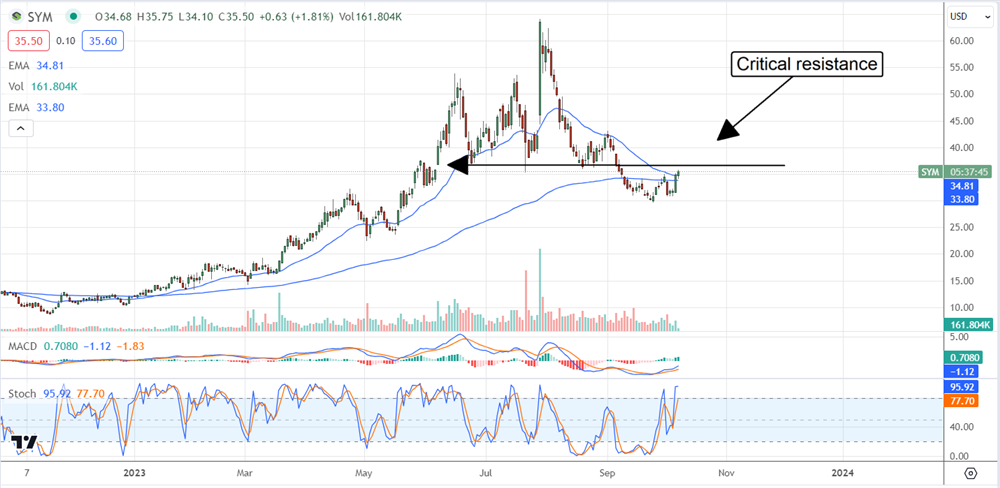
Symbotic (NASDAQ: SYM) stock is down about 50% from the summer highs, but all is not lost. The market has reached the bottom and is at a critical price point that could lead to a rebound this year. Based on the information, Symbotic is emerging as a leader in AI/robotics and stands to gain traction on top of its already well-established business.
This means that a retest of the summer highs is more than possible and that news highs are likely; the only question is when the rally will start and how long it will take the market to get there.
Symbotic Emerges as a Robotics Leader
Symbotic’s offerings are targeted at warehouse automation but come with a suite of development labs working to advance the science. Computer vision is among the avenues of progress which the company uses extensively. They are working to advance binocular, 3-D vision, and LiDAR coupled with neural networks, edge computing, and object detection/manipulation. The robots are moving objects around warehouses now; eventually, these robots could be advanced to the point of manufacturing capability.
The opportunity today is providing automated warehouse equipment, software, and services. Customers include all of Walmart’s distribution centers and warehouses for Target and Albertson’s. This list is expected to expand over the next year as production capability ramps and the growing backlog is whittled down.
Results are Impressive, and Future Business is Assured
Symbotic’s results this year are stellar, and the backlog suggests the future business is assured. The Q2 results included 77% YOY growth, 20% of outperformance, and cautious guidance. The guidance assumes a sequential revenue downtick contrary to the trend and the backlog. The backlog was reported at $23 billion, which amounts to roughly 20 years of business at the 2023 pace. More importantly, the company’s growth trajectory has it set up to produce break-even results on an adjusted basis in Q3, and the company could easily surpass that outlook.
Symbotic has the Support of SoftBank, a Japan-based technology holding company and investment firm. Support includes bringing the business to the public market via SPAC and becoming a client. SoftBank is purchasing Symbotic robotic systems for its warehouses and forming a joint venture called GreenBox Systems.
GreenBox Systems is a joint venture between SoftBank and Symbotic to bring Symbotic warehouse automation to small and mid-sized businesses on a rental basis. This move unlocks a significant opportunity; the global warehouse automation market is expected to grow at a 17% CAGR through 2030 to reach $71 billion.
Symbotic, Well-Capitalized and on Track for Profits
Symbotic has worked the last year diligently to improve margin and is on track to reach profitability by year-end. The outlook for next year has profits ramping in tandem with revenue growth and there is more than enough capital on the books to sustain operations until then. The Q3 results included $513 million in cash and securities, up nearly $50 million YOY, with $39 million in losses (only $3 million on an EBITDA basis).
The Analysts Drive Symbotic Higher
The consensus price target for Symbotic tracked by Marketbeat topped out since the last earnings report but is trending higher compared to last quarter and last year, implying more than a 40% upside for this market. The next visible catalyst will be the Q3 results, which may be underestimating the company’s strength.
The market for Symbotic stock is showing signs of a bottom. The market is showing support at the 150-day and 30-day EMA’s, which may propel it higher over the next few weeks. In this scenario, the SYM market should move above the $36.50 level soon and possibly trend higher through the end of the year.