Recent retail trends beg the question of which companies are getting money from the consumer. Walmart (NYSE: WMT) and Target (NYSE: TGT) reported that consumers were shifting from discretionary to everyday health and beauty products, affecting their inventory positions and store focus.
Results from the consumer products companies suggest that money is flowing toward them. Consumer products include health, beauty, and everyday items such as toilet paper, toothpaste, and shampoo, many of which have enduring brand loyalty.
Consumer staples stocks, including product makers such as Proctor & Gamble (NYSE: PG), have struggled to gain traction in 2023, but the stage is set for them to shine in 2024. Among the attractions are relative value within the group compared to historical norms, a high yield relative to historical norms and the S&P 500 (NYSEARCA: SPY), and an outlook for sustained growth that includes capital return growth.
The weakest stock on this list has a 28-year history of sustained annual distribution increases and the financial power to extend the streak for decades. Others are Dividend Kings or close enough to count.
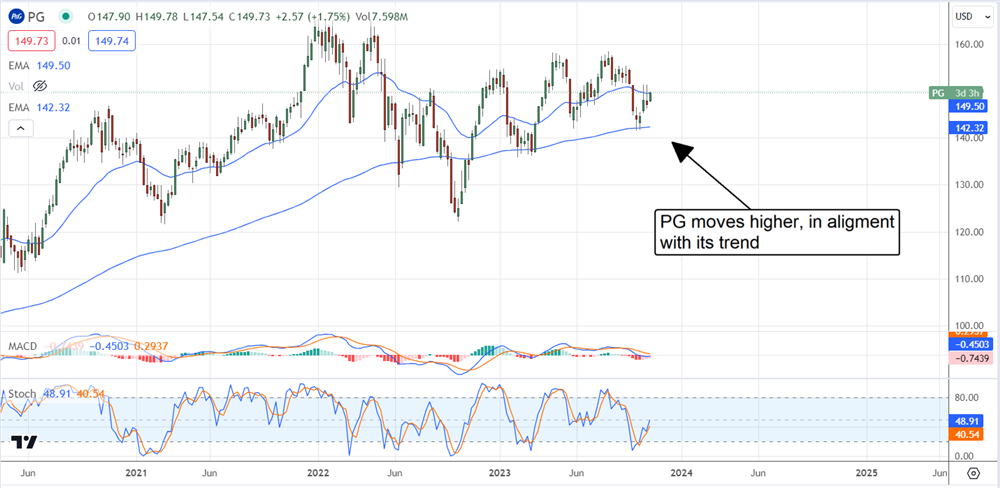
Proctor & Gamble: consumer products market leader
Proctor & Gamble's portfolio of brands is sufficiently large that it is safe to say most Americans, if not all, have at least one in their home. Products range from Pampers to Pantene and Old Spice to Oral-B, spanning the range of household and personal care needs. The company will bring in more than $85 billion in 2023 and is on pace to grow the top line by mid-single-digits next year.
Trading at 23X earnings, PG stock is not a value compared to the S&P 500, but it is cheap relative to recent years, and the dividend offsets the price. The stock yields about 2.5% and comes with a 60% payout ratio, which is low considering the 67-year history of increases. Given that earnings are expected to grow more than 8% in 2024, it is safe to assume distribution increases will continue without altering the company's financial position, dividend safety or outlook for distribution growth.
Proctor & Gamble's position as the market leader is made clear by the analysts. The analysts rate the stock a Moderate Buy compared to weaker ratings for other top consumer names, and they see it rising at least 10% over the next year.
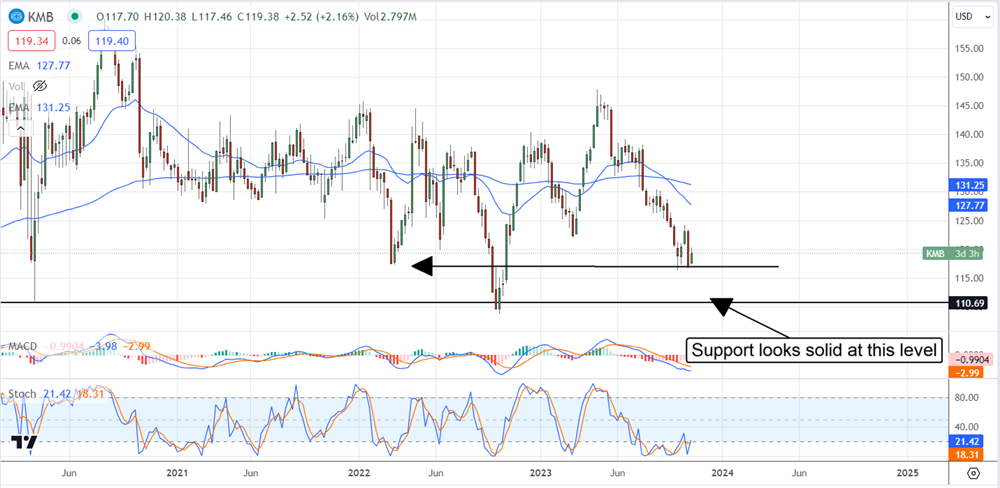
Kimberly-Clark: a high-yield value and Dividend King
Kimberly-Clark Corporation (NYSE: KMB) is another company whose brands are ubiquitous among consumers. The company is performing in alignment with the consumer staples group, positing low-double-digit growth and offering value and yield among product makers. The stock trades at 18X earnings, the lowest valuation in this grouping. The low value helps boost the yield, about 3.95%, although there are some caveats. Kimberly-Clark has one of the highest payout ratios and lowest distribution CAGRs, so investors looking for aggressive growth may wish to look elsewhere.
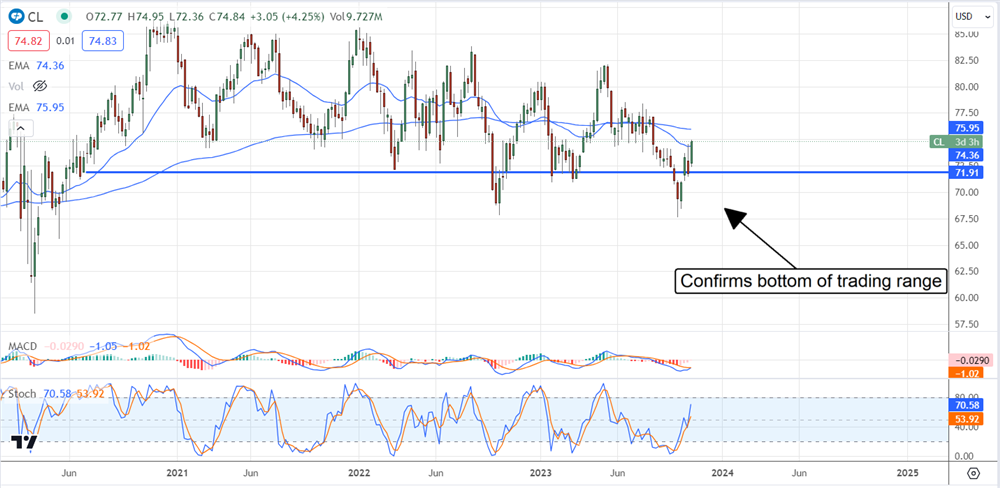
Analysts like Colgate-Palmolive Company
The analysts prefer Colgate-Palmolive Company (NYSE: CL) to names like Kimberly-Clark and have it pegged at Moderate Buy. The price target implies a 10% upside, aligning with the outlook for Proctor & Gamble. Recent activity includes several lowered price targets, but most are still above the current consensus. Within that, there is also an Upgrade from Hold to Buy from Stifel Nicolaus, which anticipated a bottom in the consumer products category. Colgate-Palmolive's Q3 results met expectations, including top- and bottom-line strength and raised guidance. This stock trades at 23X earnings, pays about 2.6% yield, and is a Dividend King.
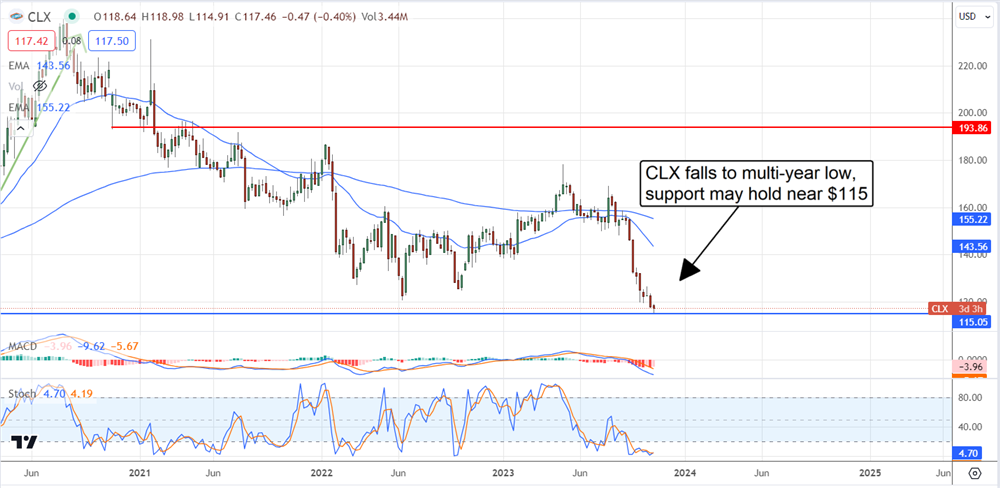
Clorox trades at a 5-year low
Shares of Clorox (NYSE: CLX) went on a roller-coaster ride during the pandemic, with people buying everything on the shelf and then not. Today's takeaway is that the stock trades at a 5-year low while business is stabilized above the pre-pandemic level.
Analysts don't expect much from the Q4 report; in fact, the bar is set so low it will be hard for the company to miss, and the outlook for next year includes growth, so the bottom in price action may be near. Regarding the dividend, this Dividend near-King pays over 4.0% at current levels, but there is some risk. The payout ratio is dangerously high in 2023 but improves relative to the 2024 outlook, and the balance sheet is healthy.
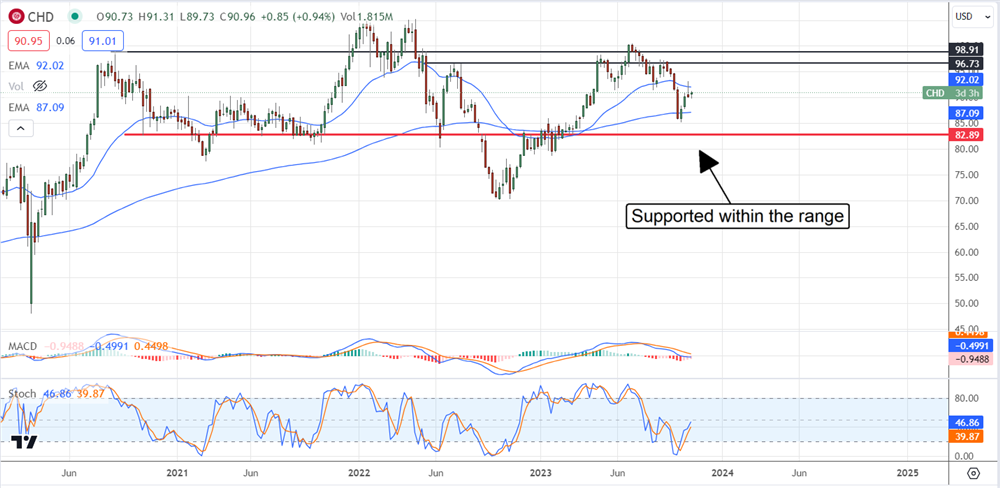
Church & Dwight: wealth-building for the long-haul
Investors looking to build value with the next Dividend King may be interested in Church & Dwight (NYSE: CHD). The company has a history of 28 consecutive increases and a low 33% payout ratio. At this level, the company can sustain many years of distribution increases without earnings growth, and there is earnings growth in the forecast. The only downside is the low current yield, about 1.2%.