Shoe Carnival (NASDAQ: SCVL) is a multifaceted story that begins with a company with intrinsic value to consumers and a push toward digital. It ends with Salesforce.com (NASDAQ: CRM), the leading Customer Relationship Management firm. The combination has unlocked increased profitability, and the company is on track to resume growth in 2024. The takeaway is that Shoe Carnival’s ability to generate cash and pay dividends is as healthy as ever and has the company on track for robust distribution growth.
The Q4 report includes another double-digit increase, this time 11% and slower than the last few years, but enough to excite the market and get it sprinting higher.
"Our growth strategies to increase scale, modernize our customer experience, leverage customer data, and carry the hottest branded merchandise are working. As a result, the total earnings per share generated over the last two years exceeded the earnings per share the corporation achieved over the 13 years combined. As we move forward, we expect this profit level to continue on our track to becoming a multi-billion-dollar retailer by 2028," said CEO Mark Worden.
Shoe Carnival Moves Up On Mixed Quarter
Shoe Carnival had a mixed quarter but not a bad quarter, and the details are skewed in favor of investors. The $290.78 million in revenue is down 7.2% compared to last year and missed the consensus by $18 million, but the margin news is impressive. Gross margin improved by 770 basis points and is expected to sustain a high-double-digit margin in fiscal 2023. The operating margin improved to 9.9% and shy of the double-digit mark, to more than a quintuple since 2019. This is well above the consensus mark and left the GAAP earnings at $0.79 or $0.01 better than expected and at record levels despite the top-line weakness.
The guidance is favorable but tepid relative to the Marketbeat.com consensus estimate and 2023 results. The company is expecting $1.26 to $1.32 billion in net revenue, which is a range that suggests a slight YOY decline is possible. The top end of the range is also below the consensus, as is the guidance for earnings. The takeaway is that analysts fearful of lowering their targets were relieved the guidance was not worse. Coupled with margin growth, earnings power, and the dividend increase, it was enough to spark a rally.
Sell-Side Sentiment Is Shifting
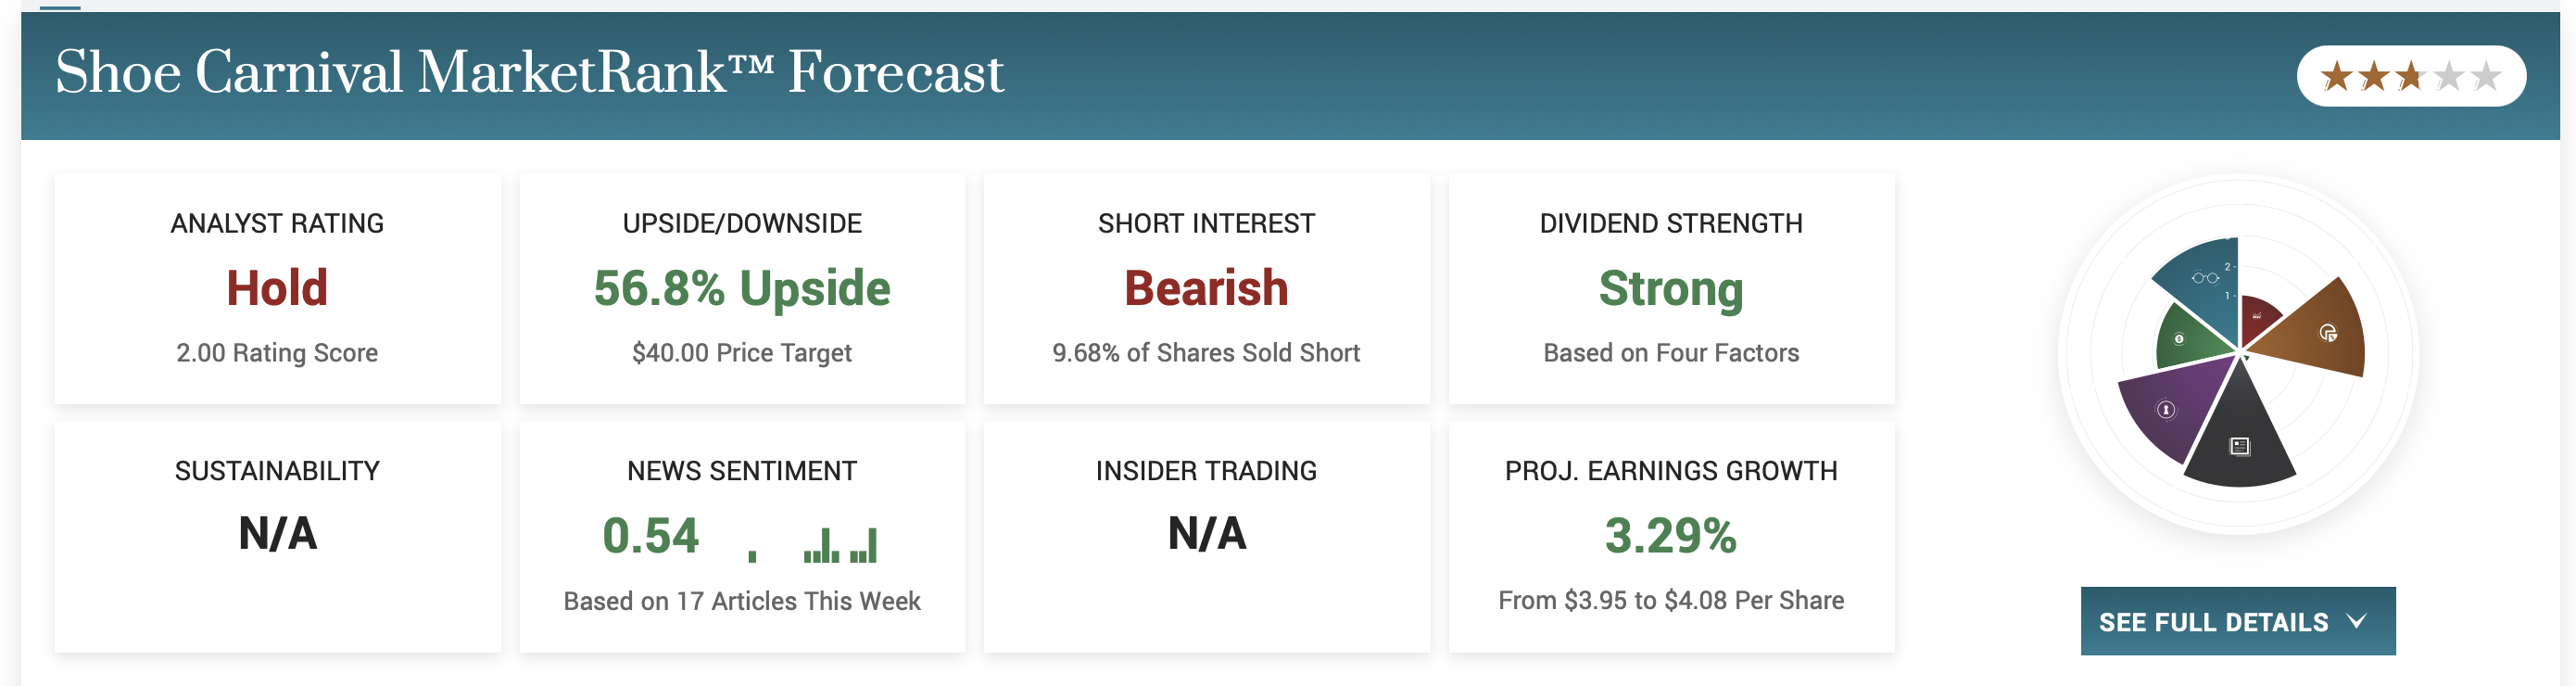
Marketbeat.com’s analyst tracking tools show little interest in this stock from that quarter, but the institutions have been buying. The institutions aren’t buying heavily, but they are buying on balance and have their holdings up to 65% and growing. Buying is outpacing selling by 2:1 in the 12-month statistics. Recent buyers include Alliancebernstein and Morgan Stanely, which own more than 1.0% of the company.
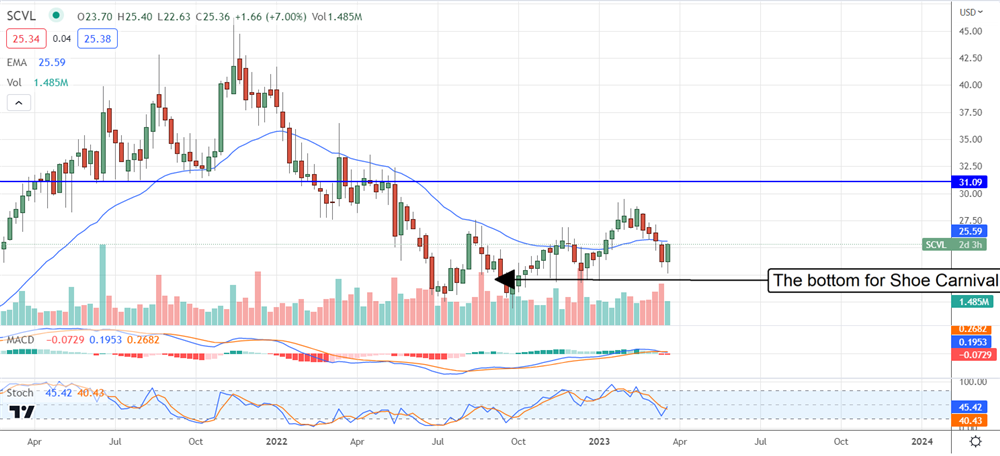
The chart reflects the analysts' disinterest and presents an interesting opportunity. The post-release action is bullish and shows support at a higher level than the previous and a strengthening bottom. If this action continues, the stock will trade at only 15X the low end of its earnings guidance and could quickly move up to the $30 level. If the analysts get interested again, it could go even higher.