Agilent Technologies Inc. (NYSE: A) stock is underperforming the market, trading down 19% year-to-date. Agilent is a leading global provider of laboratory technologies and equipment.
It counts some of the most well-known biotechnology, healthcare, diagnostic and applied materials companies in the world as clients, including Abbott Laboratories (NYSE: ABT), Thermo Fisher Scientific Inc. (NYSE: TMO) and Roche Holding AG (OTCMKTS: RHHBY). While shares were punished for their lowered guidance, the company is still very profitable. The company has stated that has seen longer sales cycles, especially with startup biotechs tightening their wallets in the uncertain macroeconomic climate.
Core Growth
On May 23, Agilent released its fiscal second-quarter 2023 results for the quarter ending April 2023. The company reported a non-GAAP earnings-per-share (EPS) profit of $1.27 versus consensus analyst estimates of $1.26, beating estimates by one cent. GAAP net income was $302 million, up from $274 million in the year-ago period. Revenues rose 6.8% year-over-year (YoY) to $1.72 billion, beating analyst estimates of $1.67 billion. Revenues were up 9.5% core with growth across all end markets and regions.
Revenues by Segment
Agilent has several divisions focused on each respective product and service. Its life sciences and applied markets group (LSAG) grew 8% year-over-year (YoY) revenue to $968 million. The operating margin was 27.3%. This division provides instruments and services to enable researchers and scientists to perform life science applications like DNA sequencing, metabolomics and protein analysis. It also provides products for applied markets like food safety, forensics and environmental testing.
Its Agilent cross-lab group (ACG) segment saw 10% YoY revenue growth with 26.6% operating margins. This division provides equipment, instruments, software and services to laboratories in various industries, including healthcare, pharmaceuticals, food and beverage, environmental and forensics.
Its diagnostics and genome group (DGG) had a 1% YoY revenue increase to $362 million and a 20.2% operating margin. This division provides products and services for clients to perform clinical diagnostics and genomic research.
Cutting Down Guidance
Agilent issues downside guidance for fiscal quarter three 2023 EPS between $1.36 to $1.38 versus $1.44 consensus analyst estimates. Revenues are expected between $1.64 billion to $1.77 billion versus $1.77 billion. Fiscal full-year 2023 EPS is expected between $5.60 to $5.65 versus $5.69 consensus analyst estimates on revenues between $6.93 billion to $7.03 billion versus $7.09 billion consensus analyst estimates.
Analysts Piling into the Clown Car
At least 10 analysts reiterated their existing ratings and lowered price targets. Key Banc lowered its analyst rating to "sector weight" from "overweight."
Key Banc’s analyst Paul Knight commented that the company's emerging biotech (3% of historical revenue) was at zero level of activity while large biopharma (33% of revenue) was more conservative on spending. Agilent cited no slowdown in its bioprocess business and more normalized China growth. He explained that a recovery needed in margins and a lack of revenue catalysts in the back half the analyst downgraded Agilent to "sector weight."
You can find Agilent Technologies analyst ratings and price targets on MarketBeat.
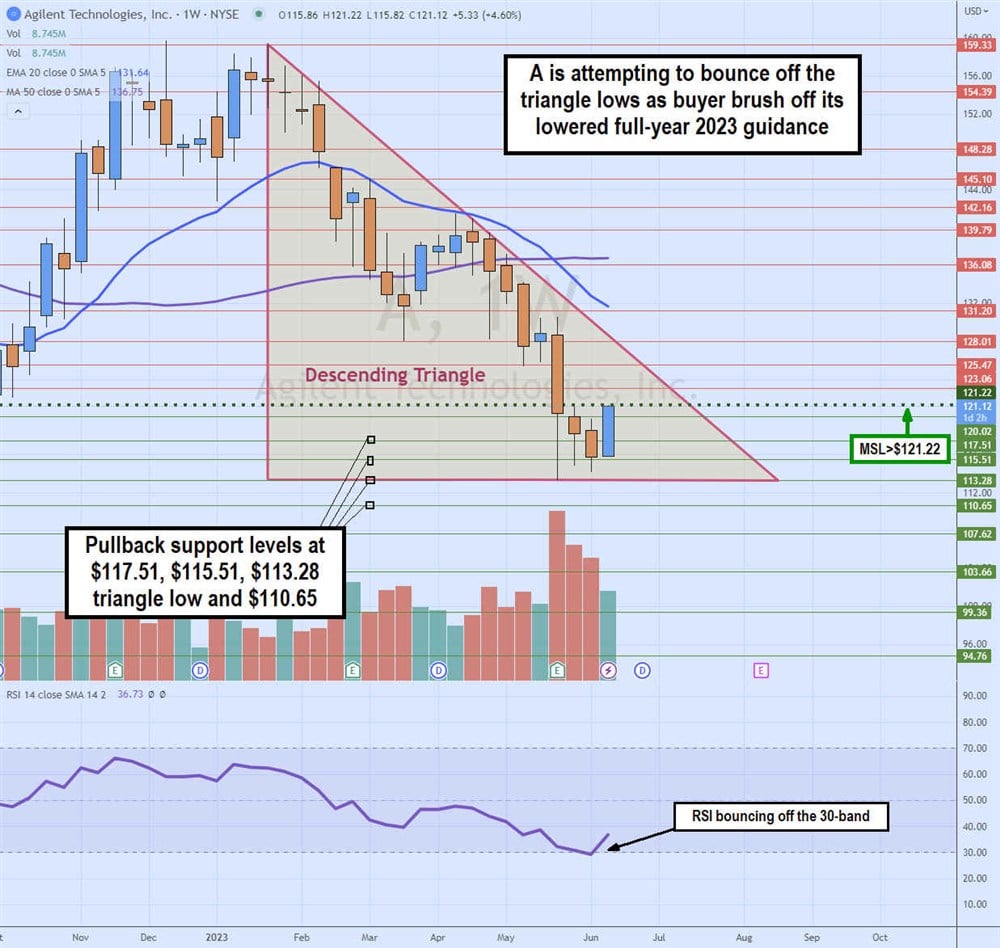
Weekly Descending Triangle
The weekly candlestick chart illustrates a weekly triangle with a clear descending trendline and flat-bottom trendline at $113.28. The triangle commenced after peaking at $159.33 in January and selling off, making lower highs on the descending trendline. A fell to a low of $113.28 in May. Shares continued to fall, forming consecutive lower-body lows.
A weekly market structure low (MSL) trigger forms on a breakout through $122.22. The weekly RSI is bouncing off the oversold 30-band indicating the weekly reversal in momentum back to the upside. The weekly 20-period exponential moving average (EMA) resistance falls at $131.64, followed by the weekly 50-period MA at $136.75. Pullback support levels are at $117.51, $115.51, $113.28 triangle low and $110.65.