Ross Stores Inc. (NASDAQ: ROST) is the largest off-price apparel and home fashion retailer in the United States, with over 1,800 stores in 43 states and the District of Columbia. The retail/wholesale sector giant just opened 43 new Ross Dress for Less and four dd's DISCOUNTS stores across 22 states in September and October of 2024. This concludes its 2024 goal of opening a total of 89 new stores.
It also sets Ross Stores in a strong position heading into the all-important holiday shopping season, capitalizing on the sizzling off-price shopping trend taking the nation by storm. The company competes with other major off-price retailers, including The TJX Companies Inc. (NYSE: TJX), Burlington Stores Inc. (NYSE: BURL), and Nordstrom Inc. (NYSE: JWN), which now has more off-price Nordstrom Rack stores than its full-price flagship Nordstrom retail department stores.
The Economy Turns Consumers Into Treasure and Value Hunters
High interest rates and high inflation have led consumers to tighten their wallets and try to stretch their dollars without sacrificing quality. This shift in consumer behavior is noticeable when looking at the performance of low-price outlets like Dollar Tree Inc. (NASDAQ: DLTR), where you get what you pay for.
Consumers of all incomes are turning more to off-price stores where premium quality brands like Coach and Kate Spade, owned by Tapestry Inc. (NYSE: TPR), Michael Kors owned by Capri Holdings Ltd. (NYSE: CPRI), DKNY owned by G-III Apparel Group Ltd. (NASDAQ: GIII), Calvin Klein and Tommy Hilfiger owned by PVH Co. (NYSE: PVH) are sold at deep discounts ranging from 20% to 70% off retail pricing. More and more shoppers are addicted to the thrill of the "treasure hunt." Ross Stores are constantly changing merchandise assortments, which fosters a sense of discovery and excitement among shoppers, triggering even more frequent trips to their stores.
Growth Driven by Macroeconomic Headwinds
In its second quarter of 2024, Ross grew its revenue to $10.1 billion year-to-date (YTD), up from $9.4 billion in the first half of 2023, with comparable sales (comps) up 3% year-over-year (YoY). Total revenue rose 7% YoY to $5.3 billion with 4% comps in the second quarter. Cosmetics and Children were the most robust merchandise categories.
Procuring More Expensive Merchandise to Attract Higher Income Shoppers
Ross Stores clearly anticipates more higher income spenders into their stores, as has been the trend. For this reason, its merchandise margins actually fell 80 bps YoY as the company sought to bring in more premium branded merchandise to cater to higher-income shoppers. Despite spending more, Ross was able to bolster its operating margin by 115 bps to 12.5%.
Ross Issues In-Line Comps Guidance Due to Lower Income Spend
Ross Stores issued flat guidance for comps growth of 2% to 3% in the second half of 2024, which is on top of last year’s 5% and 7% growth in Q3 and Q4 of 2023. The company attributes this to its lower to mid-income customers having to spend more on consumer staples items, which constricts their discretionary spending capacity.
However, the company also expects to improve its cost savings and efficiencies enough to raise its full-year 2024 EPS guidance to $6.00 to $6.13, up from $5.79 to $5.98 in previous forecasts, which was raised from $5.64 to $5.89 last quarter.
ROST Stock Is in an Ascending Price Channel
An ascending price channel is an uptrend comprised of ascending parallel upper and lower trendlines representing higher highs and higher lows. A breakdown occurs when the stock collapses under the lower trendline and continues to fall.
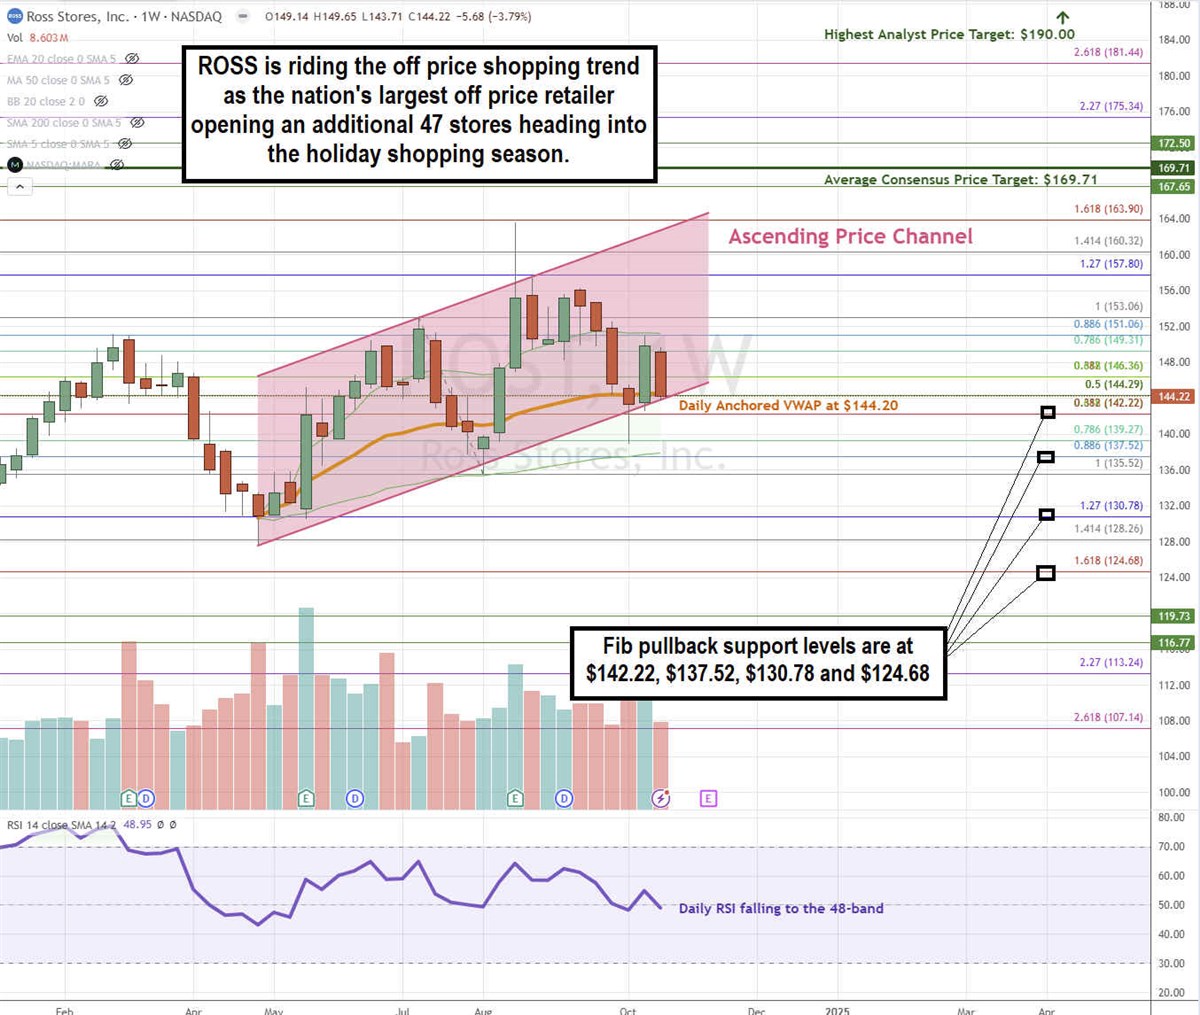
ROST's ascending channel formed after the $127.53 swing low on April 29, 2024. Shares managed to form higher highs on bounces and higher lows on pullbacks. Shares are testing the lower trendline, which also overlaps with its daily anchored VWAP at $144.20. The daily RSI has fallen to the 48-band. Fibonacci (Fib) pullback support levels are at $142.22, $137.52, $130.78, and $124.68.
Ross Stores’ average consensus price target is $169.71 implying a 17.6% upside, and its highest analyst price target sits at $190.00. It has 14 analysts' Buy ratings and three Hold ratings. The stock trades at 23.2x forward earnings.
Actionable Options Strategies: Bullish options investors enter ROST on a pullback using cash-secured puts at the Fib pullback support levels or take a bullish call debit spread for less capital than owning the stock while minimizing the downside with capped upside gains.


