The Campbell's Co. (NASDAQ: CPB) recently changed its name from Campbell Soup Co. in November 2024. The new name better describes the consumer staples sector leader’s diverse portfolio of brands. Shares sold off 6% following its lackluster fiscal first quarter 2025 report. The company reported FQ1 EPS of 89 cents, beating analyst estimates by 2 cents. Revenues rose 10.1% YoY to $2.77 billion, missing consensus estimates of $2.80 billion. In addition to reaffirming flat fiscal full year 2025 top and bottom estimates, its CEO Mark Clouse announced his departure to become the new president of the Washington Commanders National Football League (NFL) team on Jan. 31, 2025. Mick Beekhuizen will be replacing Clouse as CEO.
1) Campbell’s Stock Is Historically Undervalued
While Campbell's FQ1 earnings weren’t a barn burner, they weren’t awful. The company still had 10.1% YoY revenue growth and was profitable, beating consensus estimates by 2 cents. While revenues did come in shy, the stock is still trading at a 22% discount. Shares are trading down 1.16% year-to-date (YTD) compared to the S&P 500 index, trading up 27.88% as of Dec. 7, 2024. As a consumer defensive stock, it can hedge against market downturns. Campbell’s faces tough competition against giants like PepsiCo Inc. (NASDAQ: PEP) and Mondelez International Inc. (NASDAQ: MDLZ).
2) Campbell’s Iconic Brand Portfolio and Additional Rao’s Brand Has Pricing Power
While tightening budgets have caused many consumers to trade down to private label brands, Campbell's has a loyal following that helps it maintain pricing power. Campbell's is known for its flagship Campbell’s soups, making it the United States market leader in wet soup, but its portfolio stretches beyond that. It includes various popular brands of snacks like Pepperidge Farms, Goldfish, Cape Cod potato chips, Snyder's of Hanover pretzel, Swanson broths and stocks, V8 vegetable juice, Prego pasta sauce, and Garden Fresh Gourmet salsa and dips.
The $2.7 billion acquisition of Sovos Brands added Rao’s pasta sauces and pasta, Michael Angelo’s frozen entrees, and Noosa yogurt brands. Notably, the addition of Rao's makes Campbell's a sauce powerhouse. Note that Rao's generated 37% YoY organic sales growth in 2023, which was the bulk of the $1 billion in sales that Sovos generated.
Campbell's saw the growth potential and created the Distinctive Brands segment under its Meals & Beverages division. It pairs the growing premium Pacific Foods brand of organic soups and sauces with Rao’s, noosa and Michael Angelo’s premium products. This premium growth driver segment is helmed by Senior Vice President and General Manager Risa Cretella, who was recently the Chief Sales Officer at Sovos Brands.
3) Campbell’s Dividend Has Remained Consistent for Over 40 Years
Campbell's has been a consistent dividend payor for over 40 years. The company raised its quarterly dividend by 5.39% to 37 cents per share, illustrating its strong cash position and steady profits. Its annual dividend yield is at 3.46%.
4) CPB May Trigger a Head and Shoulders Reversal
A head and shoulders pattern is comprised of three price peaks represented by the first peak, known as the left shoulder, followed by the highest peak, called the head, and a lower price peak, called the right shoulder. The pullback lows off each peak represent the neckline support. The breakdown triggers when the stock collapses below the neckline. A reversal breakout can trigger if the stock can rise through the peak of the right shoulder.
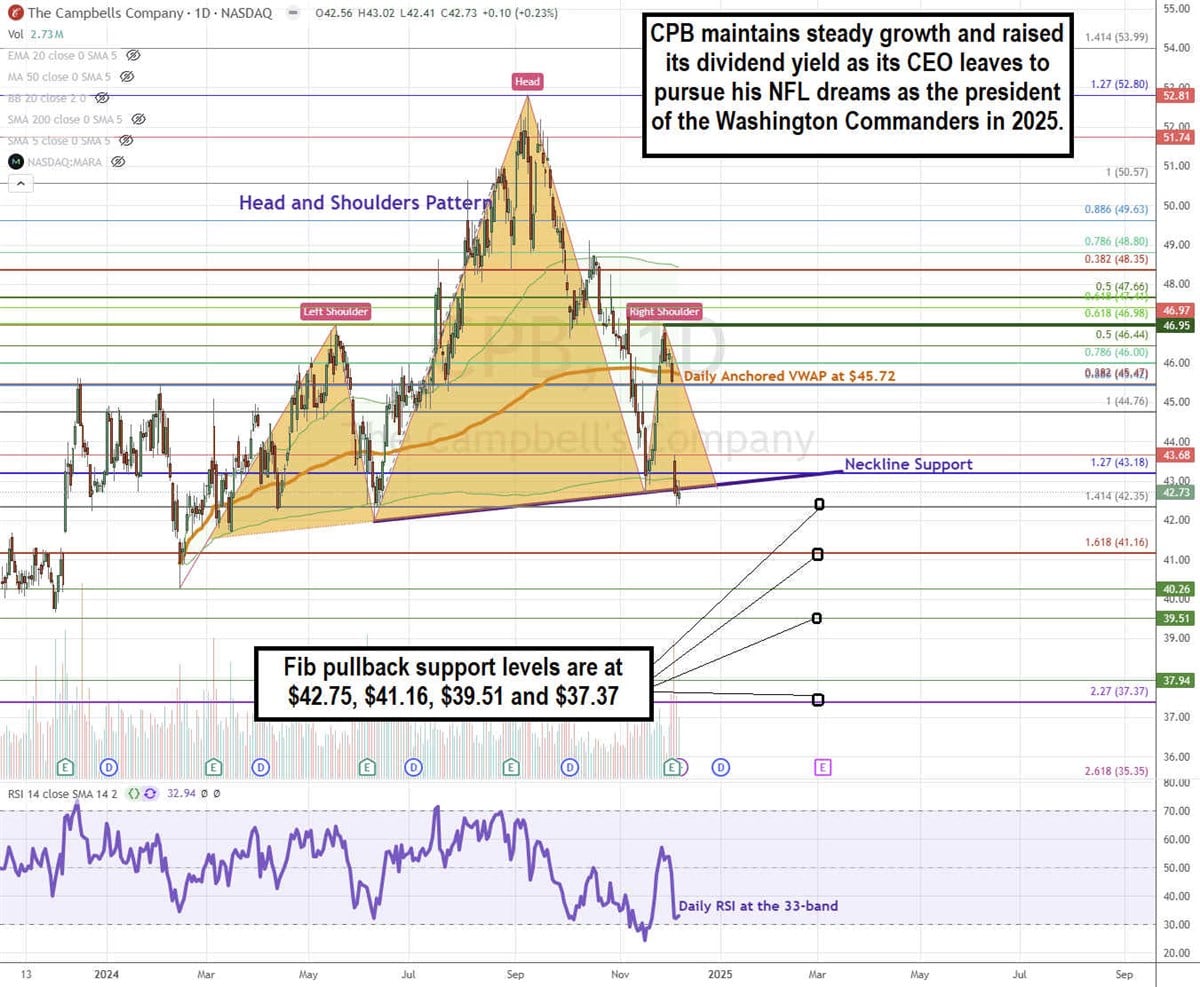
CPB formed the left shoulder peak near $45.95 before returning to the neckline support. The head formed at $52.80. The right shoulder peaked at the left shoulder peak at $45.95 before shares fell back to retest the neckline support near $43.00. The daily anchored VWAP resistance is $45.72, which overlaps with the right and left shoulder peaks as the reversal trigger if CPB can rise above it. The daily RSI is attempting to curl back up off 33-band. Fibonacci (Fib) pullback support levels are at $42.75, $41.16, $39.51, and $37.37.
Actionable Options Strategies: Bullish investors can consider using cash-secured puts to buy STX at the Fib pullback support levels for entry and write covered calls to execute a wheel strategy for income in addition to the 3.46% annual dividend yield.