
Amplitude Inc. (NASDAQ: AMPL) is a leading AI-powered product analytics platform enabling companies to better understand how customers engage with their digital products and services. It tracks customers' behaviors and identifies trends and patterns, providing data-driven insights to help businesses improve engagements and make better product decisions. The business services sector fintech has many high-profile clients in diverse industries, including Walmart Inc. (NYSE: WMT), Zoom Communications Inc. (NASDAQ: ZM), Atlassian Inc. (NASDAQ: TEAM), and Intuit Inc. (NASDAQ: INTU).
Amplitude stock is trading down 9.9% year-to-date (YTD) as of Dec. 6, 2024. However, it's trading down 87% from its all-time high of $87.98 in November of 2021.
A Leader in the Product Analytics Platform Niche
While the product analytics segment is a niche, Amplitude is considered the leader in its niche, followed by private company Pendo. Adjacent competitors include Alphabet Inc. (NASDAQ: GOOGL), Google Analytics, which analyzes website traffic and marketing analytics, and Adobe Inc. (NASDAQ: ADBE) Analytics, which analyzes customer journeys across various channels like mobile, web, and offline. Amplitude can integrate data from all sources without the need for data scientists or engineers.
They’ve simplified the onboarding process with the launch of “Amplified Made Easy," which allows users to implement Amplified with a single line of code. It enables users to “get started, get insights, and get value faster.” This is a driving force for its net revenue retention (NRR) growth, which has bottomed out as annual recurring revenue (ARR) starts to ramp up. More companies are coming on board the notion of product analytics before launching new digital products or services; this is a tailwind that fits right into Amplitude's wheelhouse.
Growth Is Starting to Rev Up Again
Amplitude reported its third quarter of 2024 EPS of 3 cents, beating consensus expectations by 2 cents. GAAP loss was $20 million, while non-GAAP income was $1.6 million. The non-GAAP figure backed out the $21.5 million stock-based compensation expense, related payroll taxes, and amortization of intangible assets. Paying customers grew 41% YoY to 3,486. The customers with an ARR of $100,000 or more rose 13% YoY to 567.
Revenues grew 6.5% YoY to $75.2 million, beating consensus estimates of $74.12 million. ARR rose 9% YoY to $298 million. The third quarter's operating cash flow was $6.2 million, with $4.5 million in free cash flow (FCF), representing a 5% YoY decrease in the FCF margin.
Amplitude CEO Spenser Skates also reiterated the growth acceleration, commenting, "We are on the path to reaccelerating growth. Product innovation is the biggest driver of long-term value for Amplitude. Our platform continues to evolve to serve more users, more workflows, and more outcomes. Customers see that and are turning to us for our integrated and easy-to-use experience."
Amplitude Issues In-Line Guidance
The company expects a full-year EPS of 4 cents to 6 cents, versus 6 cents, according to consensus estimates. Revenue for the full year 2024 is expected to be between $297.1 million and $298.1 million versus $295.72 million.
AMPL Forms a Cup Pattern
A cup pattern is comprised of a cup lip line resistance at a swing high and a rounding bottom at the following swing low. Shares rally back up to retest the cup lip line resistance before a pullback and potential handle formation ensue. This may trigger a cup and handle breakout if the stock can break through the cup lip line resistance price level.
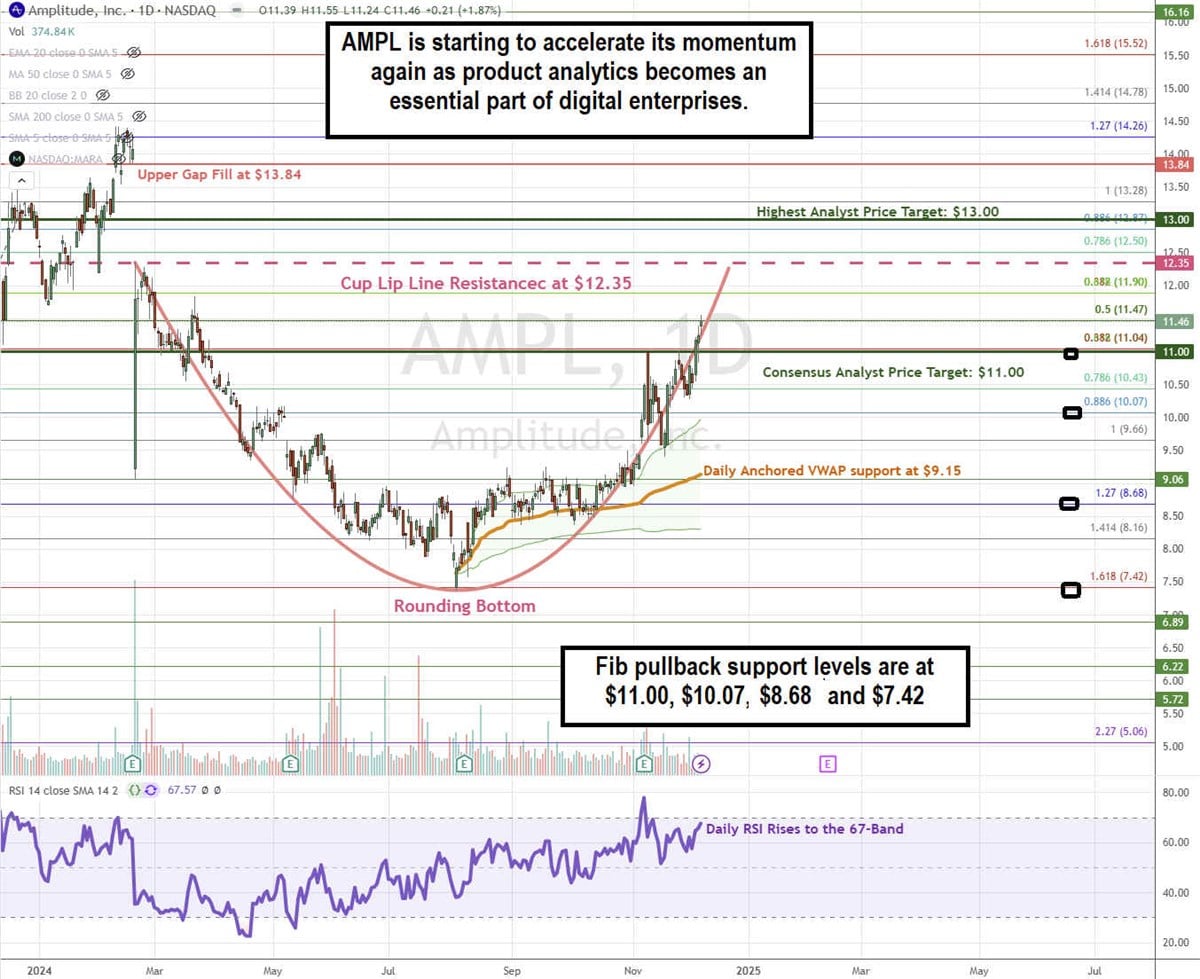
AMPL formed its cup line resistance at the $12.35 gap fill before collapsing to a low of $7.42 on Aug. 5, 2024. This set up the rounding bottom and rallied back up towards the cup lip line again. The daily anchored VWAP support is rising at $9.15. AMPL has already overshot the $11.00 consensus price target. The daily RSI is rising toward the 70-band. Fibonacci (Fib) pullback support levels are at $11.00, $10.07, $8.68, and $7.42.
AMPL’s average consensus price target is $11.00, implying a 4% downside as of Dec. 6, 2024. Its highest analyst price target is $13.00. The stock has six Hold ratings and one Sell rating. It has a small 2.14% short interest.
Actionable Options Strategies: Bullish investors can consider using cash-secured puts at the Fib pullback support levels to buy the dip. If assigned the shares, then writing covered calls at upside Fib levels executes a wheel strategy for income.