Unsurprisingly, off-price retailers like Ross Stores (NASDAQ: ROST) and TJX Companies (NYSE: TJX) outperform. The off-price retail segment is well-positioned after years of economic turmoil, including supply chain logjams, high inflation, high interest rates, and the ensuing inventory bloat seen among apparel manufacturers and major retailers.
Today, consumers are flocking to off-price retailers because of the value they bring to the table, and the off-price retailers have what consumers want. They’ve judiciously managed inventories and sustained fortress balance sheets, and they are faced with what TJX CEO Ernie Herrman described as “excellent buying opportunities” in the marketplace, ready to continue outperforming in the second half.
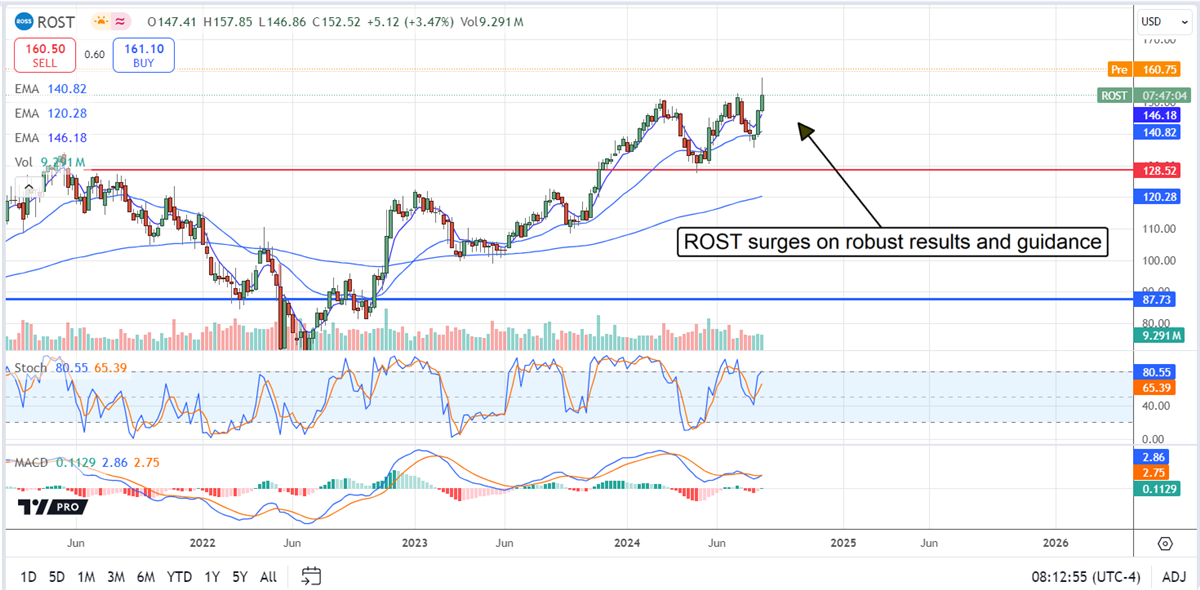
Ross Stores Surges to New Highs; Higher Highs Are Indicated
Ross Stores' Q2 was outstanding. The company reported $5.29 billion in net sales to produce industry-leading growth. The gains are driven by a 4% comp-store gain compounded by a 4.2% increase in store count. Comps are underpinned by increased ticket count and size, providing leverage for the bottom line. All regions performed well, with cosmetics and children's categories producing noteworthy strength. Strength in cosmetics is unsurprising given the strengths shown by Ulta Beauty (NASDAQ: ULTA) and e.l.f. Beauty (NYSE: ELF).
Margin news is also good. The company widened its operating margin by 115 basis points to 12.5% on increased sales leverage and declining costs. The net result is $527 million in income or $1.59 per share in GAAP EPS, 670 basis points more than forecasted by analysts' consensus.
Guidance is cautious, taking note of economic conditions, but optimistic as well. The company expects Q3 and Q4 sales to remain solid, with comps up 2% and 3% and full-year EPS near $6.06. That’s good for 9% growth, including the impact of last year’s extra 53rd week, and 13% growth when adjusted. Analysts had expected worse.
Analysts Raise Targets for Ross Stores
The analysts' response is robust. MarketBeat.com tracked more than a dozen revisions within the first 24 hours with all including a price target increase. The net result is that the consensus estimate increased more than 5%, up 30% in the last 12 months, indicating a move to $165 or higher is likely. The $165 target is sufficient for a new all-time high and will likely be reached soon. Most fresh targets are between $175 and $190 or 15% to 25% above the pre-release closing price.
Capital return and balance sheet health are central to the value. The company pays a safe and reliable $1.47, worth about 1.0% annual yield in 2024, and is expected to increase the payout at year’s end. Ross Stores pays less than 25% of its earnings and can sustain annual increases. Share buybacks are also in play. The company reduced the share count by a 1.9% average for Q2 and is on track to meet the 2024 goal of $1.05 billion in repurchases.
Regarding the balance sheet, current and total assets are up across the board, with cash up nearly 2% to $4.6 billion. Liabilities are also up but offset by a decline in long-term debt, leaving equity up 15% and leverage ultra-low. Long-term debt is now 0.3x equity.
Ross Stores Surges 5%; Another Double-Digit Gain Is Likely
Ross Stores' share price surged by 5% following the release and is likely to head higher. The jump in price action is supported by a budding technical Buy signal that could result in a sustained rally. In that scenario, Ross Stores' business will continue shining in the second half, leading analysts to increase their price targets and leading this market even higher. The risk now is that profit-taking will cap gains at the market open, leading ROST stock into a trading range.