
Casual restaurant chain Portillo’s (NASDAQ: PTLO) missed Wall Street’s revenue expectations in Q3 CY2024, but sales rose 6.9% year on year to $178.3 million. Its GAAP profit of $0.11 per share was 51.3% above analysts’ consensus estimates.
Is now the time to buy Portillo's? Find out by accessing our full research report, it’s free.
Portillo's (PTLO) Q3 CY2024 Highlights:
- Revenue: $178.3 million vs analyst estimates of $182.1 million (2.1% miss)
- EPS: $0.11 vs analyst estimates of $0.07 ($0.04 beat)
- Gross Margin (GAAP): 23.5%, down from 25.1% in the same quarter last year
- Operating Margin: 9%, in line with the same quarter last year
- Free Cash Flow Margin: 8.7%, up from 1.2% in the same quarter last year
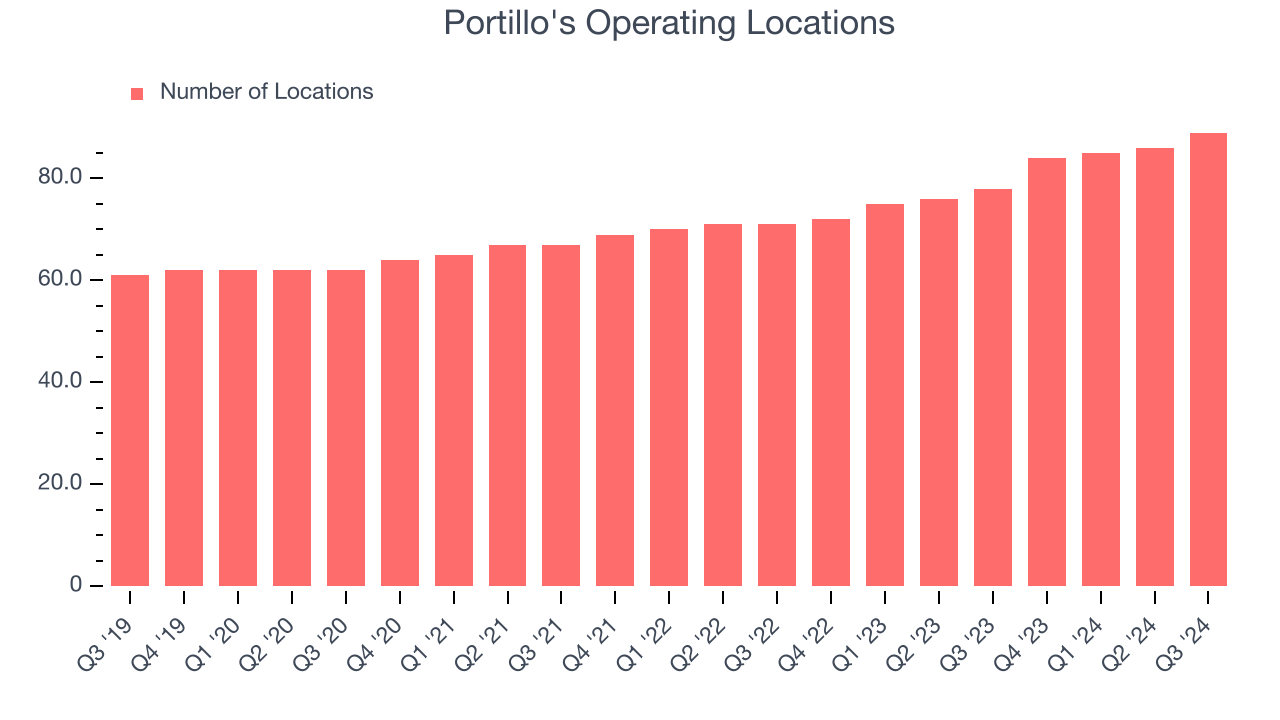
- Locations: 89 at quarter end, up from 78 in the same quarter last year
- Same-Store Sales were flat year on year (3.9% in the same quarter last year)
- Market Capitalization: $843.5 million
Michael Osanloo, President and Chief Executive Officer of Portillo’s, said, “While our top line results for the quarter fell short of expectations, I’m proud of how our team protected margins and drove cash flow. We’re profitable, we’re controlling the levers we can, and we’re positioned for lasting, long-term growth.”
Company Overview
Begun as a Chicago hot dog stand in 1963, Portillo’s (NASDAQ: PTLO) is a casual restaurant chain that serves Chicago-style hot dogs and beef sandwiches as well as fries and shakes.
Traditional Fast Food
Traditional fast-food restaurants are renowned for their speed and convenience, boasting menus filled with familiar and budget-friendly items. Their reputations for on-the-go consumption make them favored destinations for individuals and families needing a quick meal. This class of restaurants, however, is fighting the perception that their meals are unhealthy and made with inferior ingredients, a battle that's especially relevant today given the consumers increasing focus on health and wellness.
Sales Growth
A company’s long-term performance is an indicator of its overall business quality. While any business can experience short-term success, top-performing ones enjoy sustained growth for multiple years.
Portillo's is a small restaurant chain, which sometimes brings disadvantages compared to larger competitors benefitting from better brand awareness and economies of scale.
As you can see below, Portillo's grew its sales at a decent 8.2% compounded annual growth rate over the last five years (we compare to 2019 to normalize for COVID-19 impacts) as it opened new restaurants and increased sales at existing, established dining locations.
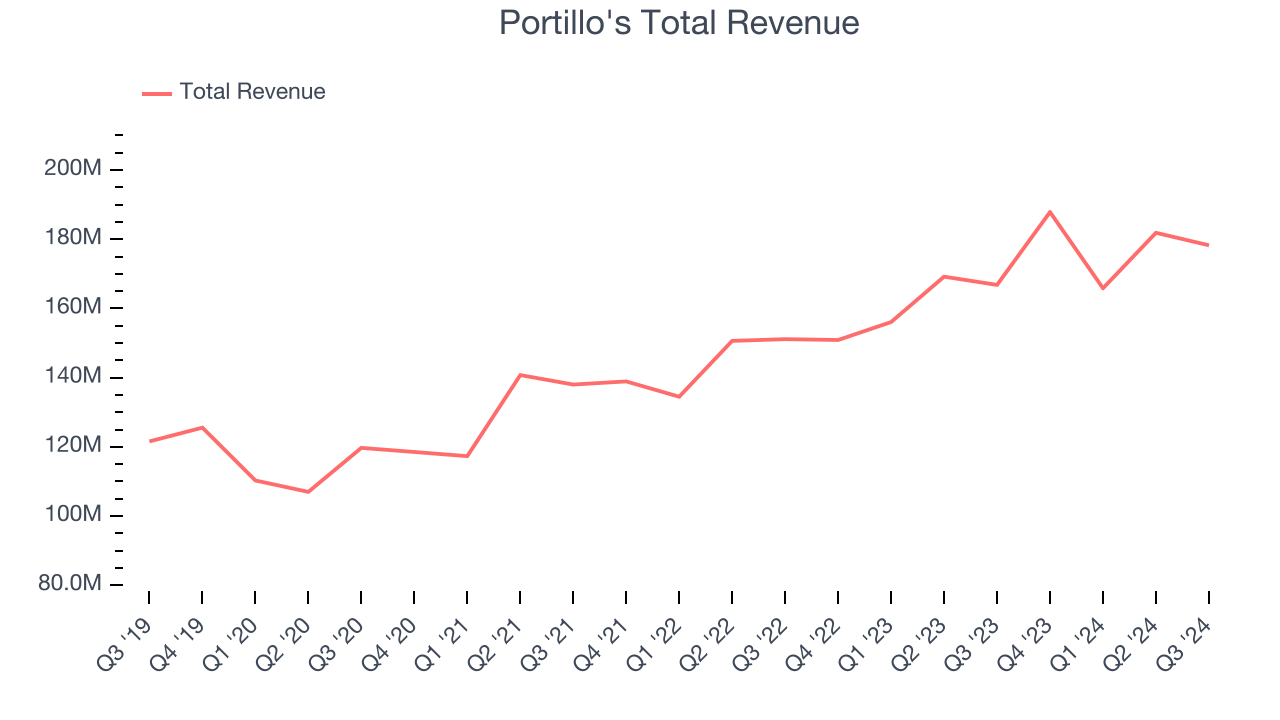
This quarter, Portillo’s revenue grew 6.9% year on year to $178.3 million, missing Wall Street’s estimates.
Looking ahead, sell-side analysts expect revenue to grow 9.7% over the next 12 months, an acceleration versus the last five years. This projection is noteworthy and indicates the market thinks its newer offerings will catalyze higher growth rates.
When a company has more cash than it knows what to do with, buying back its own shares can make a lot of sense–as long as the price is right. Luckily, we’ve found one, a low-priced stock that is gushing free cash flow AND buying back shares. Click here to claim your Special Free Report on a fallen angel growth story that is already recovering from a setback.
Restaurant Performance
Number of Restaurants
A restaurant chain’s total number of dining locations influences how much it can sell and how quickly revenue can grow.
Portillo's sported 89 locations in the latest quarter. Over the last two years, it has opened new restaurants at a rapid clip and averaged 10.7% annual growth, among the fastest in the restaurant sector. This gives it a chance to scale into a mid-sized business over time.
When a chain opens new restaurants, it usually means it’s investing for growth because there’s healthy demand for its meals and there are markets where the concept has few or no locations.
Same-Store Sales
The change in a company's restaurant base only tells one side of the story. The other is the performance of its existing locations, which informs management teams whether they should expand or downsize their physical footprints. Same-store sales is an industry measure of whether revenue is growing at those existing restaurants and is driven by customer visits (often called traffic) and the average spending per customer (ticket).
Portillo’s demand has been spectacular for a restaurant chain over the last two years. On average, the company has increased its same-store sales by an impressive 3.3% per year. This performance along with its meaningful buildout of new restaurants suggest it’s playing some aggressive offense.
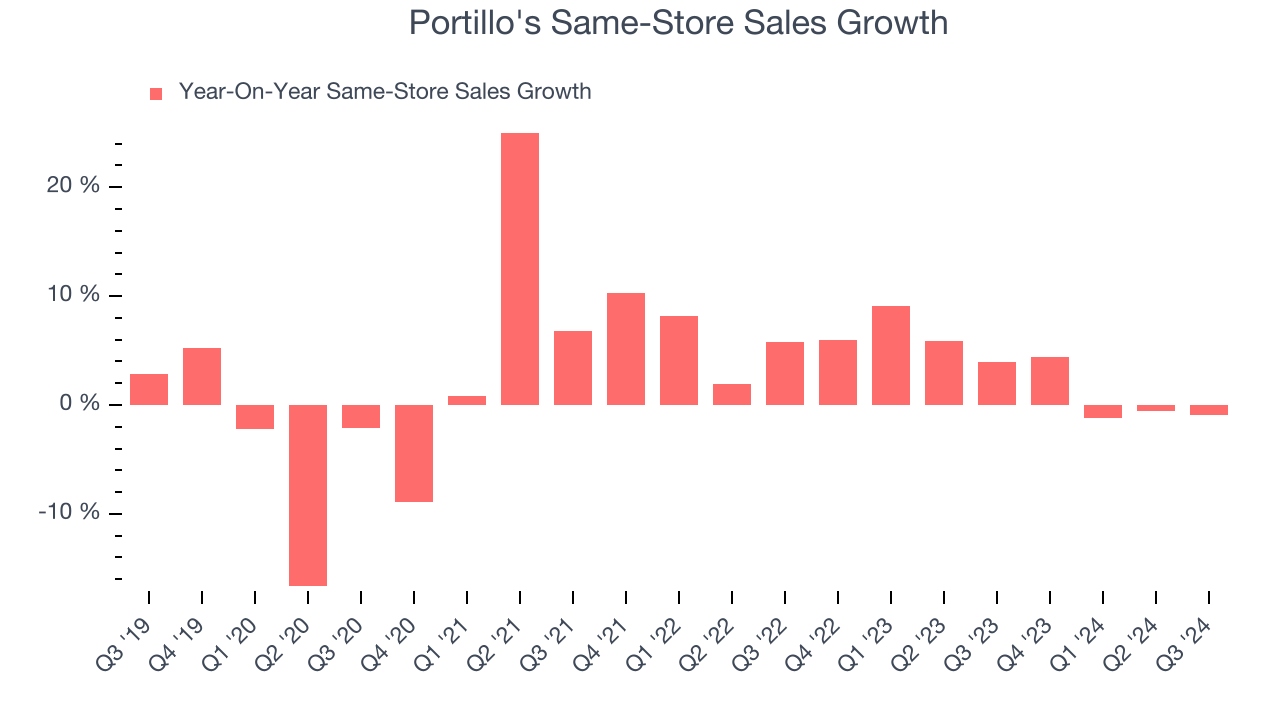
In the latest quarter, Portillo’s year on year same-store sales were flat. By the company’s standards, this growth was a meaningful deceleration from the 3.9% year-on-year increase it posted 12 months ago. We’ll be watching Portillo's closely to see if it can reaccelerate growth.
Key Takeaways from Portillo’s Q3 Results
We were impressed by how significantly Portillo's blew past analysts’ EPS expectations this quarter due to better-than-expected operating profit margins. On the other hand, its revenue missed analysts’ expectations. Overall, we think this was a mixed quarter. The stock traded up 2.5% to $13.99 immediately following the results.
Portillo's may have had a good quarter, but does that mean you should invest right now? If you’re making that decision, you should consider the bigger picture of valuation, business qualities, as well as the latest earnings. We cover that in our actionable full research report which you can read here, it’s free.


