
Gaming company Inspired (NASDAQ: INSE) fell short of the market’s revenue expectations in Q3 CY2024, with sales falling 20% year on year to $78 million. Its GAAP profit of $0.12 per share was also 51.4% below analysts’ consensus estimates.
Is now the time to buy Inspired? Find out by accessing our full research report, it’s free.
Inspired (INSE) Q3 CY2024 Highlights:
- Revenue: $78 million vs analyst estimates of $81.35 million (4.1% miss)
- EPS: $0.12 vs analyst estimates of $0.25 (-$0.13 miss)
- EBITDA: $30.1 million vs analyst estimates of $29.14 million (3.3% beat)
- Gross Margin (GAAP): 70%, up from 50.7% in the same quarter last year
- Operating Margin: 15.3%, up from 12.5% in the same quarter last year
- EBITDA Margin: 38.6%, up from 27.4% in the same quarter last year
- Free Cash Flow was $22.5 million, up from -$12.9 million in the same quarter last year
- Market Capitalization: $265.5 million
“Our third quarter results demonstrate the resilience of our diversified business model and our ability to successfully execute across our business segments,” said Lorne Weil, Executive Chairman of Inspired.
Company Overview
Specializing in digital casino gaming, Inspired (NASDAQ: INSE) is a provider of gaming hardware, virtual sports platforms, and server-based gaming systems.
Gaming Solutions
Gaming solution companies operate in a dynamic and evolving market, and the digital transformation of the gaming industry presents significant opportunities for innovation and growth, whether it be immersive slot machine terminals or mobile sports betting. However, the gaming solution industry is not without its challenges. Regulatory compliance is a crucial consideration as companies must navigate a complex and often fragmented regulatory landscape across different jurisdictions. Changes in regulations can impact product offerings, operational practices, and market access, requiring companies to maintain flexibility and adaptability in their business strategies. Additionally, the competitive nature of the industry necessitates continuous investment in research and development to stay ahead of competitors and meet evolving consumer demands.
Sales Growth
A company’s long-term performance is an indicator of its overall business quality. While any business can experience short-term success, top-performing ones enjoy sustained growth for multiple years. Over the last five years, Inspired grew its sales at a solid 20.4% compounded annual growth rate. This is a useful starting point for our analysis.
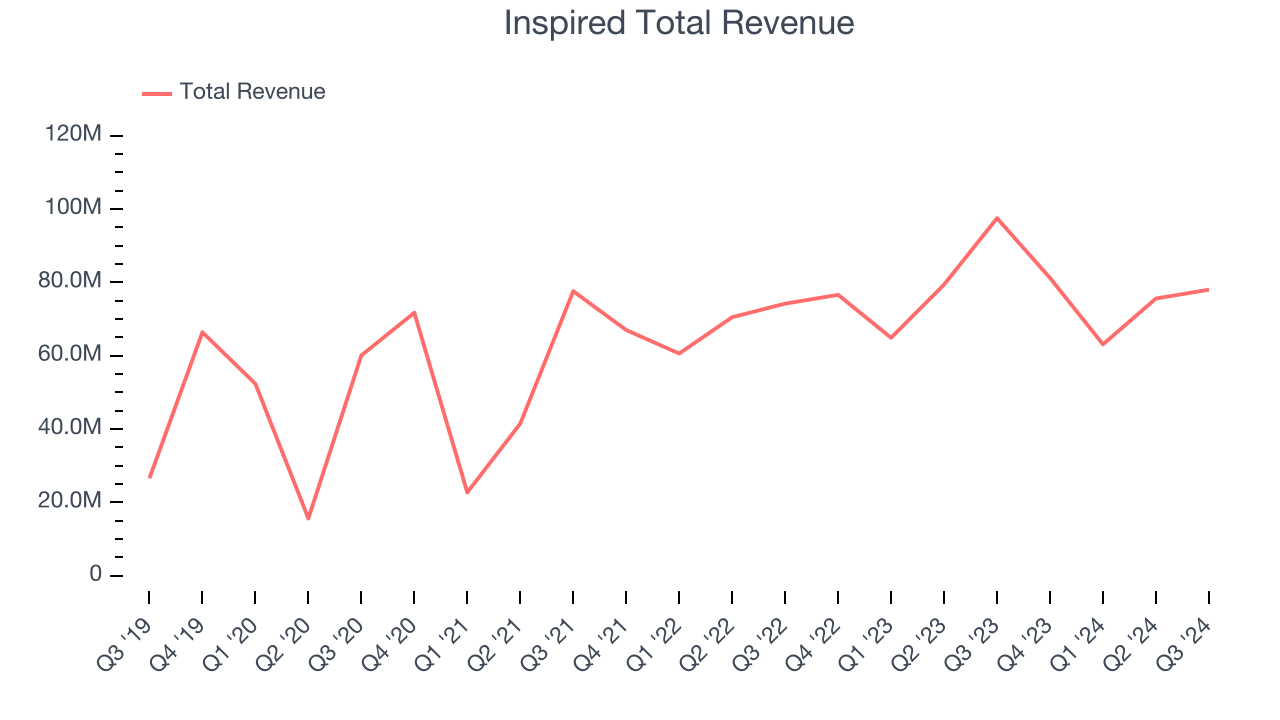
Long-term growth is the most important, but within consumer discretionary, product cycles are short and revenue can be hit-driven due to rapidly changing trends and consumer preferences. Inspired’s recent history shows its demand slowed as its annualized revenue growth of 4.6% over the last two years is below its five-year trend. 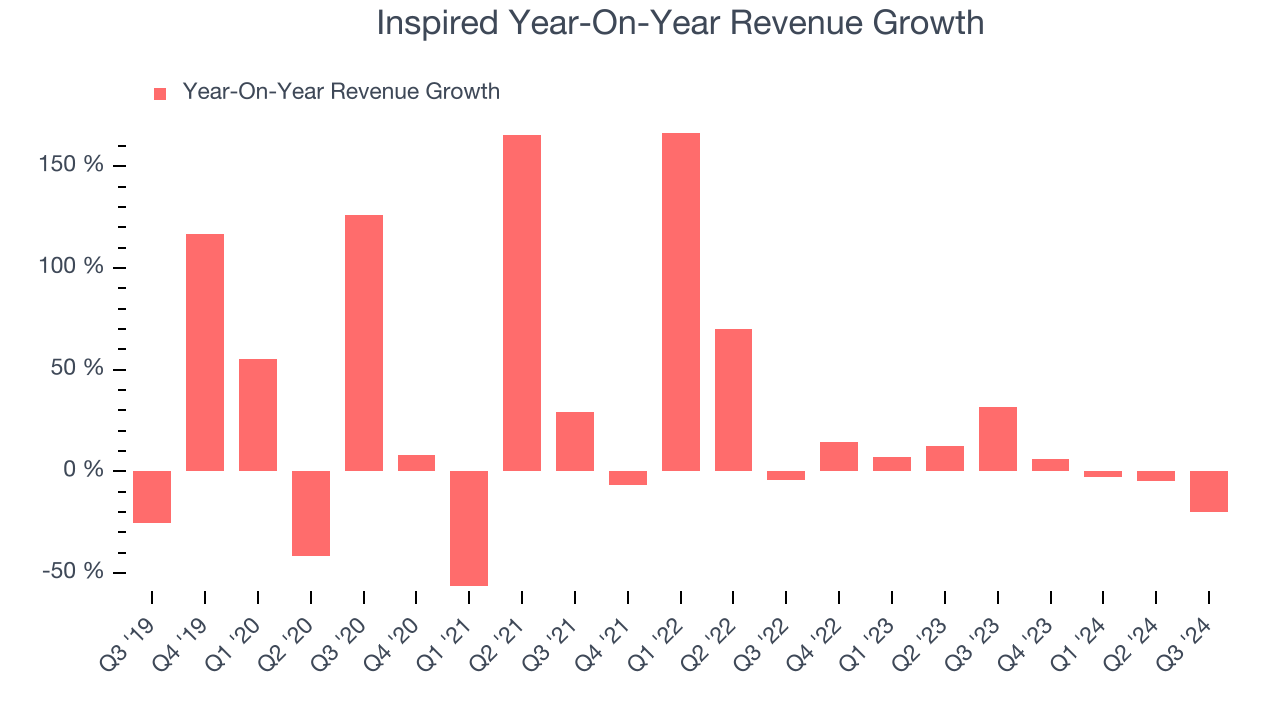
We can dig further into the company’s revenue dynamics by analyzing its three most important segments: Gaming, Leisure, and Virtual Sports, which are 29.9%, 42.7%, and 14.4% of revenue. Over the last two years, Inspired’s Gaming revenue (land-based casino games) averaged 12.4% year-on-year growth while its Leisure (gaming terminals and amusement machines) and Virtual Sports (digital gaming and sports betting) revenues were flat.
This quarter, Inspired missed Wall Street’s estimates and reported a rather uninspiring 20% year-on-year revenue decline, generating $78 million of revenue.
Looking ahead, sell-side analysts expect revenue to grow 7.7% over the next 12 months, an improvement versus the last two years. Although this projection indicates the market believes its newer products and services will catalyze better performance, it is still below average for the sector.
Here at StockStory, we certainly understand the potential of thematic investing. Diverse winners from Microsoft (MSFT) to Alphabet (GOOG), Coca-Cola (KO) to Monster Beverage (MNST) could all have been identified as promising growth stories with a megatrend driving the growth. So, in that spirit, we’ve identified a relatively under-the-radar profitable growth stock benefitting from the rise of AI, available to you FREE via this link.
Cash Is King
Although earnings are undoubtedly valuable for assessing company performance, we believe cash is king because you can’t use accounting profits to pay the bills.
While Inspired posted positive free cash flow this quarter, the broader story hasn’t been so clean. Over the last two years, Inspired’s demanding reinvestments to stay relevant have drained its resources. Its free cash flow margin averaged negative 1.6%, meaning it lit $1.56 of cash on fire for every $100 in revenue.
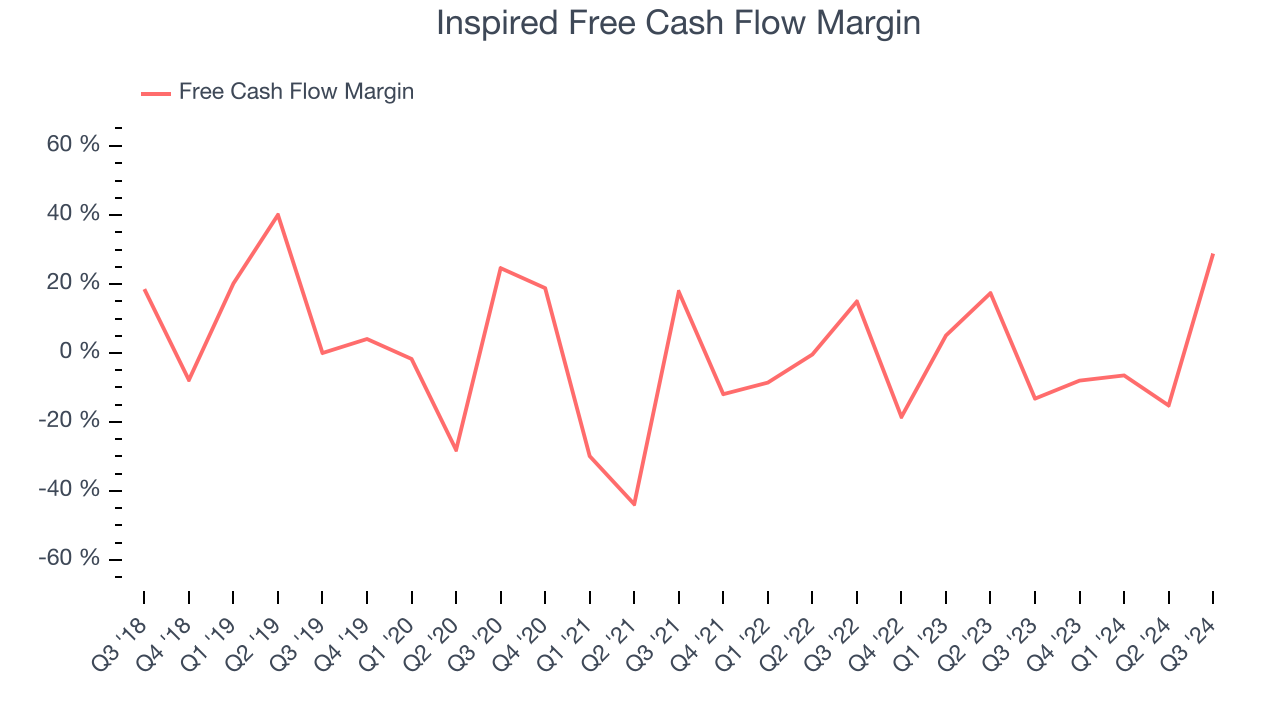
Inspired’s free cash flow clocked in at $22.5 million in Q3, equivalent to a 28.8% margin. Its cash flow turned positive after being negative in the same quarter last year, but we wouldn’t read too much into the short term because investment needs can be seasonal, causing temporary swings. Long-term trends trump fluctuations.
Over the next year, analysts predict Inspired’s cash conversion will improve. Their consensus estimates imply its breakeven free cash flow margin for the last 12 months will increase to 16.8%, giving it more money to invest.
Key Takeaways from Inspired’s Q3 Results
It was good to see Inspired beat analysts’ EBITDA expectations this quarter. On the other hand, its revenue and EPS fell short of Wall Street’s estimates. Overall, this quarter could have been better. The stock remained flat at $10.15 immediately after reporting.
So should you invest in Inspired right now? We think that the latest quarter is only one piece of the longer-term business quality puzzle. Quality, when combined with valuation, can help determine if the stock is a buy. We cover that in our actionable full research report which you can read here, it’s free.


