
Shareholders of Jack in the Box would probably like to forget the past six months even happened. The stock dropped 25.4% and now trades at $38.50. This was partly due to its softer quarterly results and might have investors contemplating their next move.
Is now the time to buy Jack in the Box, or should you be careful about including it in your portfolio? Get the full stock story straight from our expert analysts, it’s free.
Even with the cheaper entry price, we're sitting this one out for now. Here are three reasons why you should be careful with JACK and a stock we'd rather own.
Why Is Jack in the Box Not Exciting?
Delighting customers since its inception in 1951, Jack in the Box (NASDAQ: JACK) is a distinctive fast-food chain known for its bold flavors, innovative menu items, and quirky marketing.
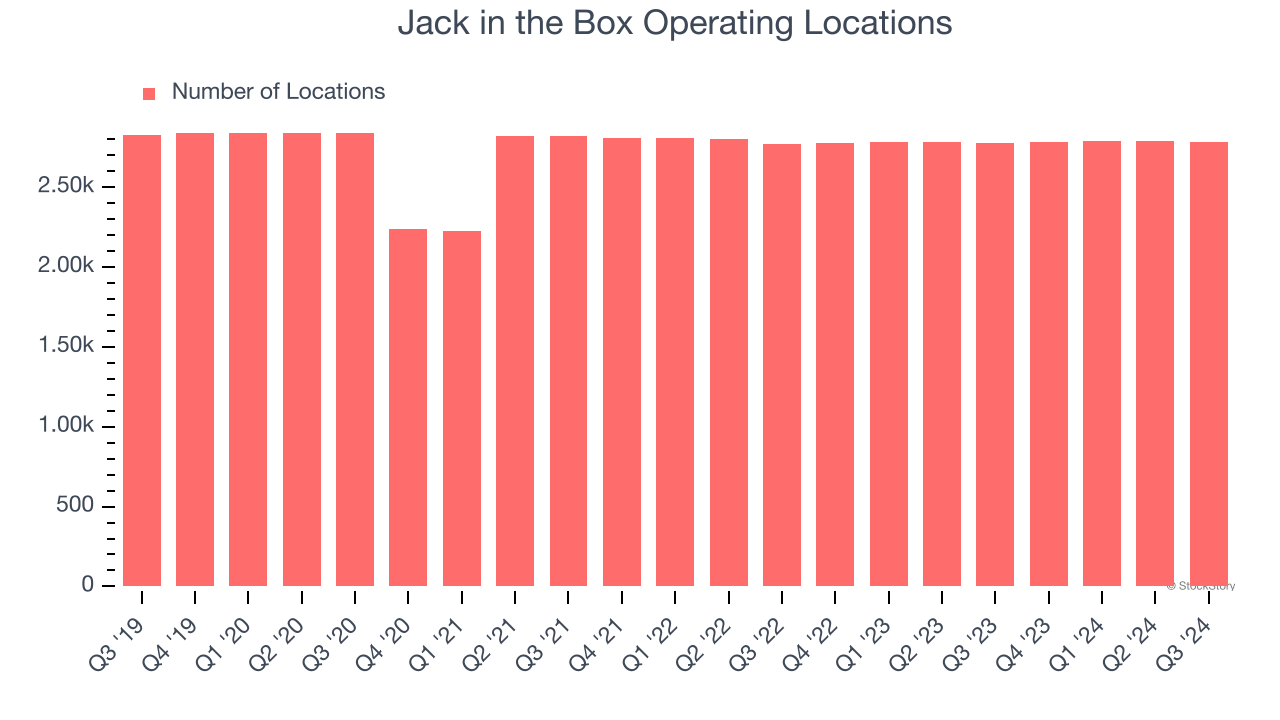
1. Lack of New Restaurants, a Headwind for Revenue
A restaurant chain’s total number of dining locations influences how much it can sell and how quickly revenue can grow.
Jack in the Box operated 2,785 locations in the latest quarter, and over the last two years, has kept its restaurant count flat while other restaurant businesses have opted for growth.
When a chain doesn’t open many new restaurants, it usually means there’s stable demand for its meals and it’s focused on improving operational efficiency to increase profitability.
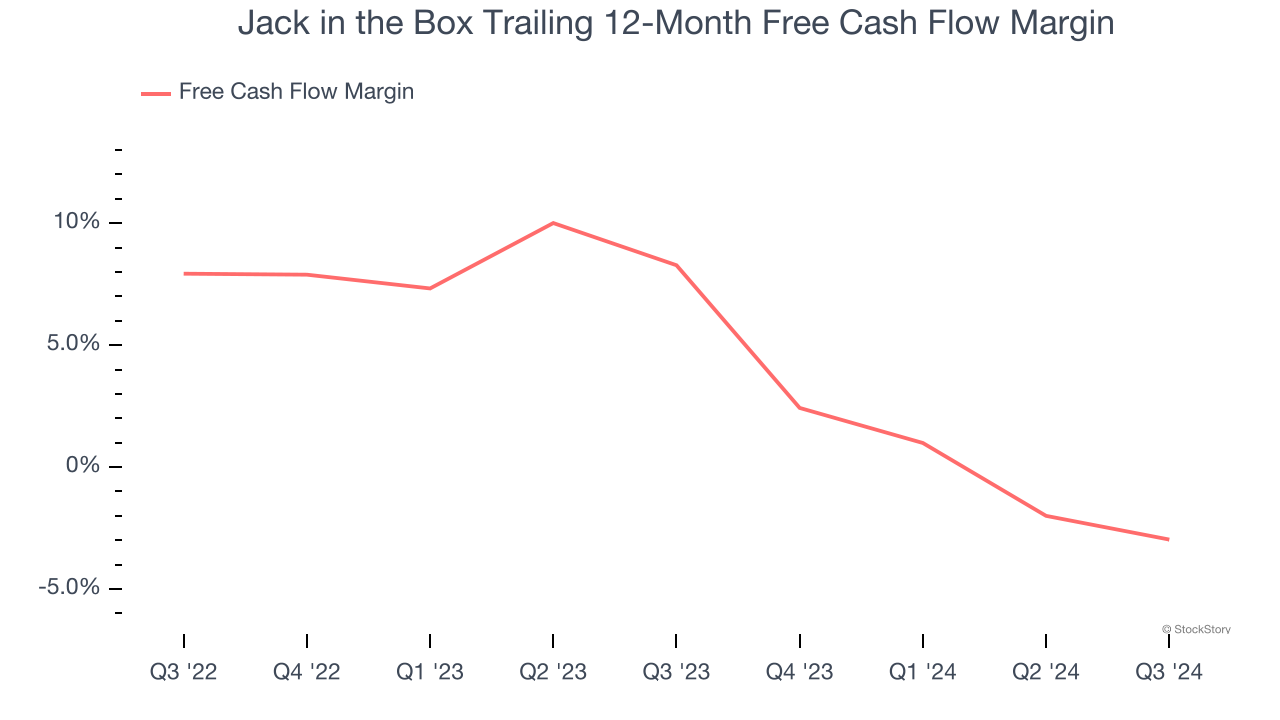
2. Free Cash Flow Margin Dropping
Free cash flow isn't a prominently featured metric in company financials and earnings releases, but we think it's telling because it accounts for all operating and capital expenses, making it tough to manipulate. Cash is king.
As you can see below, Jack in the Box’s margin dropped by 11.2 percentage points over the last year. Almost any movement in the wrong direction is undesirable because of its already low cash conversion. Jack in the Box’s free cash flow margin for the trailing 12 months was negative 3%.
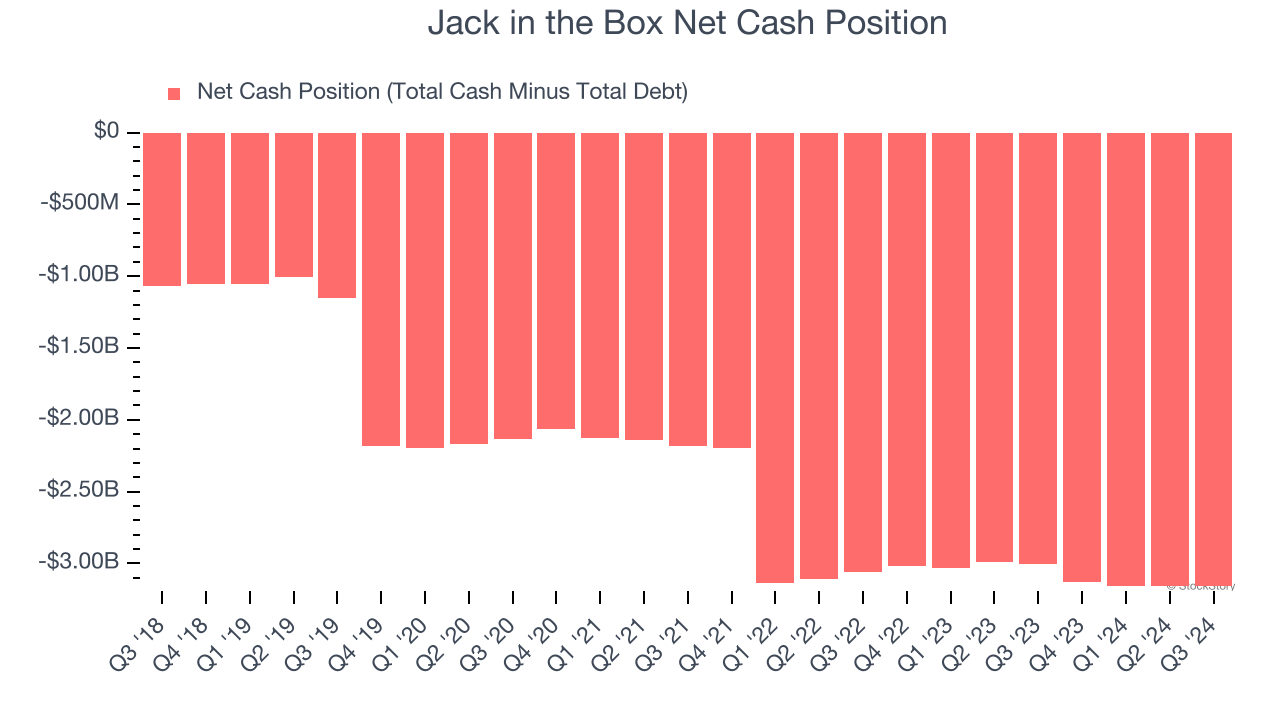
3. Short Cash Runway Exposes Shareholders to Potential Dilution
As long-term investors, the risk we care about most is the permanent loss of capital, which can happen when a company goes bankrupt or raises money from a disadvantaged position. This is separate from short-term stock price volatility, something we are much less bothered by.
Jack in the Box burned through $46.66 million of cash over the last year, and its $3.18 billion of debt exceeds the $24.75 million of cash on its balance sheet. This is a deal breaker for us because indebted loss-making companies spell trouble.
Unless the Jack in the Box’s fundamentals change quickly, it might find itself in a position where it must raise capital from investors to continue operating. Whether that would be favorable is unclear because dilution is a headwind for shareholder returns.
We remain cautious of Jack in the Box until it generates consistent free cash flow or any of its announced financing plans materialize on its balance sheet.
Final Judgment
Jack in the Box’s business quality ultimately falls short of our standards. After the recent drawdown, the stock trades at 6.1× forward price-to-earnings (or $38.50 per share). While this valuation is optically cheap, the potential downside is big given its shaky fundamentals. We're fairly confident there are better investments elsewhere. Let us point you toward Meta, a top digital advertising platform riding the creator economy.
Stocks We Would Buy Instead of Jack in the Box
The elections are now behind us. With rates dropping and inflation cooling, many analysts expect a breakout market to cap off the year - and we’re zeroing in on the stocks that could benefit immensely.
Take advantage of the rebound by checking out our Top 9 Market-Beating Stocks. This is a curated list of our High Quality stocks that have generated a market-beating return of 175% over the last five years.
Stocks that made our list in 2019 include now familiar names such as Nvidia (+2,691% between September 2019 and September 2024) as well as under-the-radar businesses like United Rentals (+550% five-year return). Find your next big winner with StockStory today for free.


