
Nordstrom has been treading water for the past six months, recording a small return of 1.3% while holding steady at $24.13. The stock also fell short of the S&P 500’s 6.6% gain during that period.
Is now the time to buy Nordstrom, or should you be careful about including it in your portfolio? Get the full stock story straight from our expert analysts, it’s free.
We're sitting this one out for now. Here are three reasons why there are better opportunities than JWN and a stock we'd rather own.
Why Do We Think Nordstrom Will Underperform?
Known for its exceptional customer service that features a ‘no questions asked’ return policy, Nordstrom (NYSE: JWN) is a high-end department store chain.
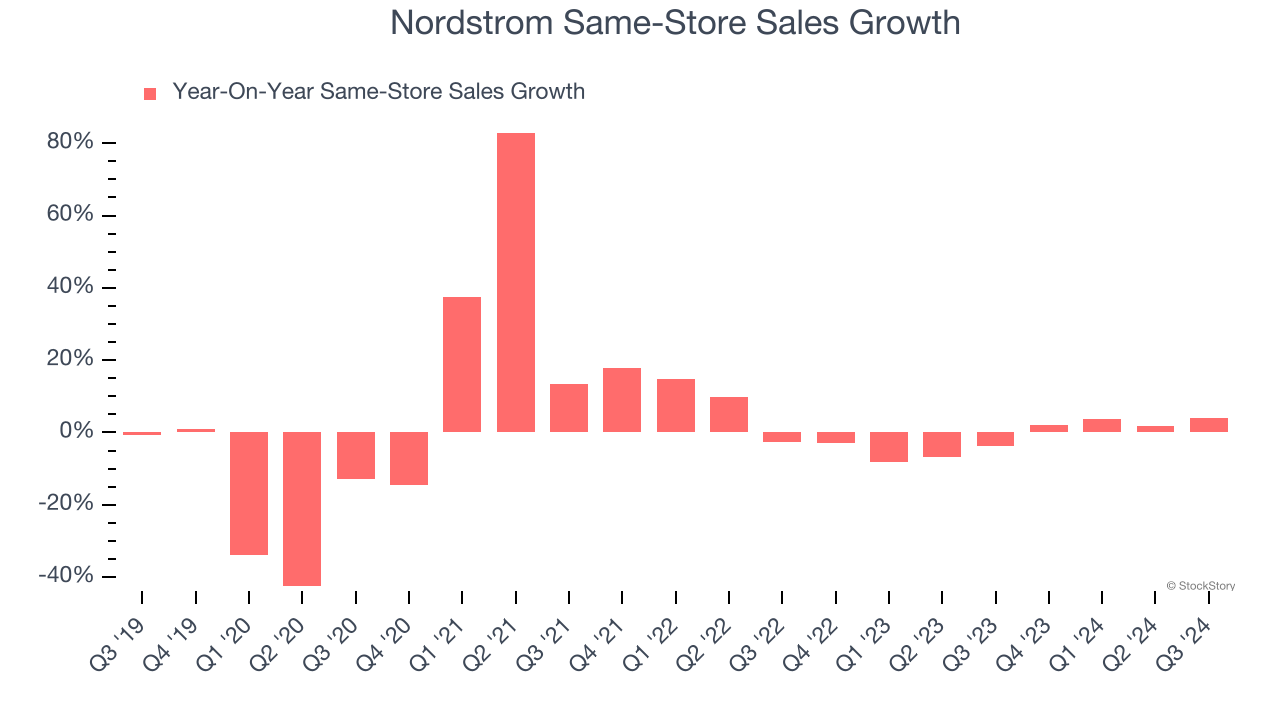
1. Shrinking Same-Store Sales Indicate Waning Demand
Same-store sales show the change in sales for a retailer's e-commerce platform and brick-and-mortar shops that have existed for at least a year. This is a key performance indicator because it measures organic growth.
Nordstrom’s demand has been shrinking over the last two years as its same-store sales have averaged 1.2% annual declines.
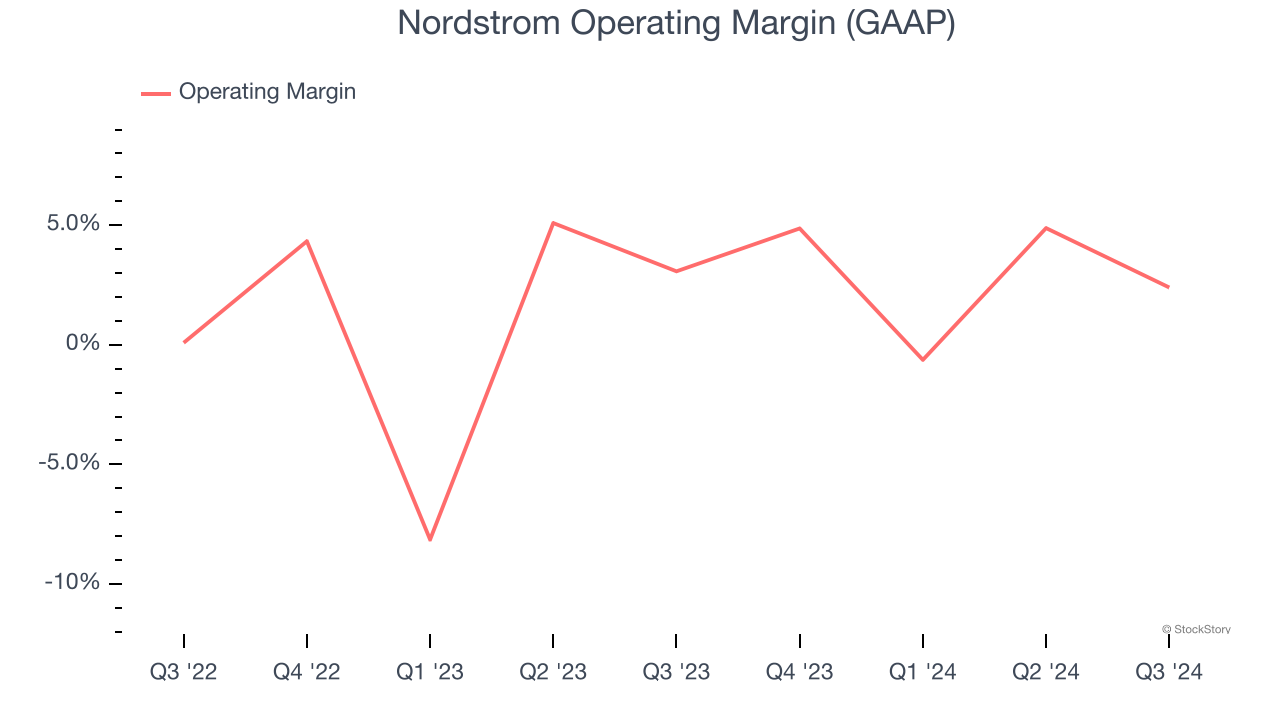
2. Weak Operating Margin Could Cause Trouble
Operating margin is an important measure of profitability for retailers as it accounts for all expenses keeping the lights on, including wages, rent, advertising, and other administrative costs.
Nordstrom was profitable over the last two years but held back by its large cost base. Its average operating margin of 2.3% was weak for a consumer retail business.
3. Previous Growth Initiatives Haven’t Paid Off Yet
Growth gives us insight into a company’s long-term potential, but how capital-efficient was that growth? A company’s ROIC explains this by showing how much operating profit it makes compared to the money it has raised (debt and equity).
Nordstrom historically did a mediocre job investing in profitable growth initiatives. Its five-year average ROIC was 3.4%, lower than the typical cost of capital (how much it costs to raise money) for consumer retail companies.
Final Judgment
Nordstrom doesn’t pass our quality test. With its shares lagging the market recently, the stock trades at 12.6× forward price-to-earnings (or $24.13 per share). While this valuation is fair, the upside isn’t great compared to the potential downside. There are better investments elsewhere. Let us point you toward Uber, whose profitability just reached an inflection point.
Stocks We Like More Than Nordstrom
The Trump trade may have passed, but rates are still dropping and inflation is still cooling. Opportunities are ripe for those ready to act - and we’re here to help you pick them.
Get started by checking out our Top 6 Stocks for this week. This is a curated list of our High Quality stocks that have generated a market-beating return of 175% over the last five years.
Stocks that made our list in 2019 include now familiar names such as Nvidia (+2,183% between December 2019 and December 2024) as well as under-the-radar businesses like Sterling Infrastructure (+1,096% five-year return). Find your next big winner with StockStory today for free.


