
Over the last six months, Avis Budget Group’s shares have sunk to $91.67, producing a disappointing 5.8% loss - a stark contrast to the S&P 500’s 12.6% gain. This was partly driven by its softer quarterly results and may have investors wondering how to approach the situation.
Is there a buying opportunity in Avis Budget Group, or does it present a risk to your portfolio? Check out our in-depth research report to see what our analysts have to say, it’s free.
Even though the stock has become cheaper, we're swiping left on Avis Budget Group for now. Here are three reasons why we avoid CAR and a stock we'd rather own.
Why Is Avis Budget Group Not Exciting?
The parent company of brands such as Zipcar and Budget Truck Rental, Avis (NASDAQ: CAR) is a provider of car rental and mobility solutions.
1. Weak Growth in Available rental days - Car rental Points to Soft Demand
Revenue growth can be broken down into changes in price and volume (for companies like Avis Budget Group, our preferred volume metric is available rental days - car rental). While both are important, the latter is the most critical to analyze because prices have a ceiling.
Avis Budget Group’s available rental days - car rental came in at 67.7 million in the latest quarter, and over the last two years, averaged 5% year-on-year growth. This performance was underwhelming and suggests it might have to lower prices or invest in product improvements to accelerate growth, factors that can hinder near-term profitability. 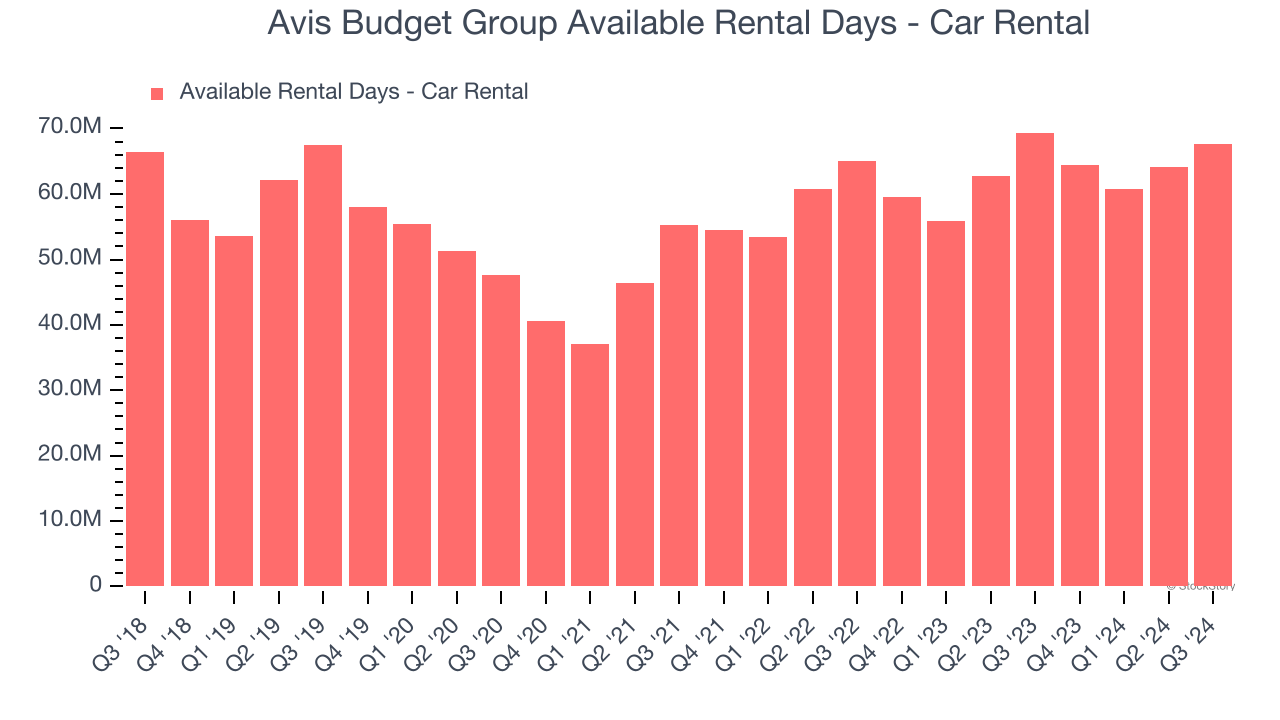
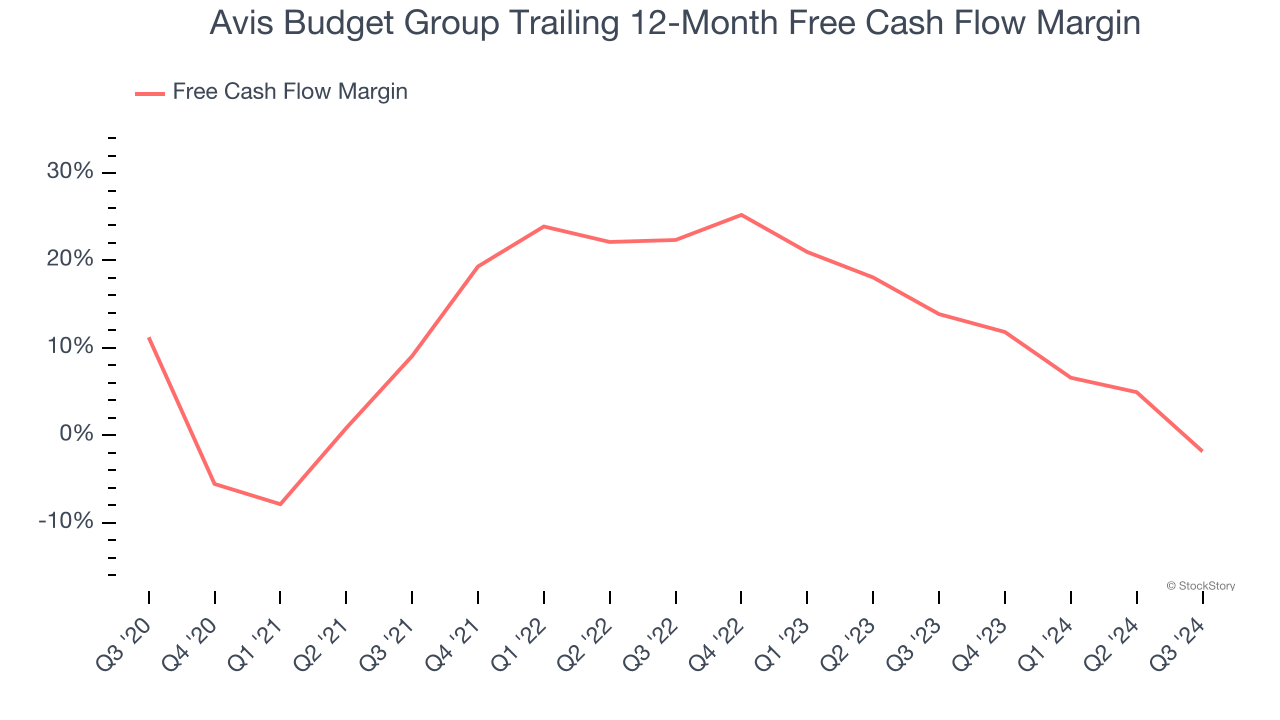
2. Free Cash Flow Margin Dropping
Free cash flow isn't a prominently featured metric in company financials and earnings releases, but we think it's telling because it accounts for all operating and capital expenses, making it tough to manipulate. Cash is king.
As you can see below, Avis Budget Group’s margin dropped by 13 percentage points over the last five years. If its declines continue, it could signal higher capital intensity. Avis Budget Group’s free cash flow margin for the trailing 12 months was negative 1.8%.
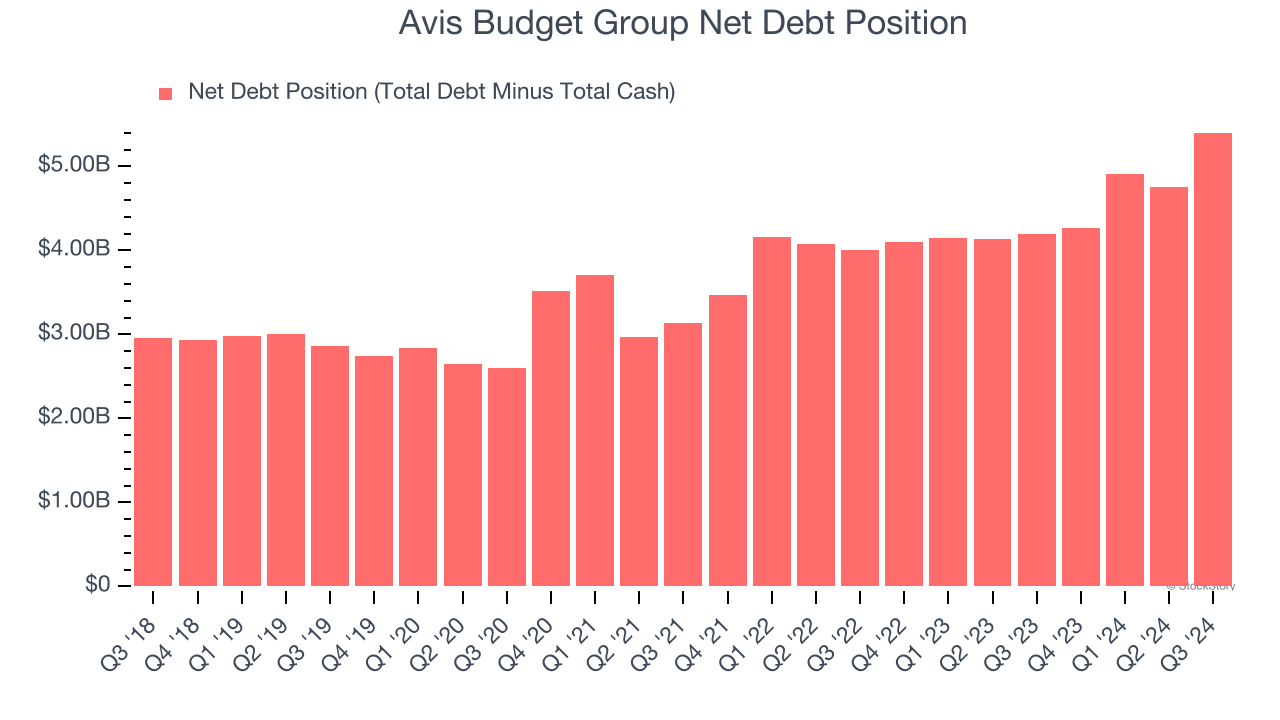
3. Short Cash Runway Exposes Shareholders to Potential Dilution
As long-term investors, the risk we care about most is the permanent loss of capital, which can happen when a company goes bankrupt or raises money from a disadvantaged position. This is separate from short-term stock price volatility, something we are much less bothered by.
Avis Budget Group burned through $215.3 million of cash over the last year, and its $6.01 billion of debt exceeds the $602 million of cash on its balance sheet. This is a deal breaker for us because indebted loss-making companies spell trouble.
Unless the Avis Budget Group’s fundamentals change quickly, it might find itself in a position where it must raise capital from investors to continue operating. Whether that would be favorable is unclear because dilution is a headwind for shareholder returns.
We remain cautious of Avis Budget Group until it generates consistent free cash flow or any of its announced financing plans materialize on its balance sheet.
Final Judgment
Avis Budget Group isn’t a terrible business, but it doesn’t pass our quality test. Following the recent decline, the stock trades at 6.9× forward price-to-earnings (or $91.67 per share). While this valuation is optically cheap, the potential downside is big given its shaky fundamentals. We're fairly confident there are better stocks to buy right now. We’d suggest looking at the most dominant software business in the world.
Stocks We Like More Than Avis Budget Group
The Trump trade may have passed, but rates are still dropping and inflation is still cooling. Opportunities are ripe for those ready to act - and we’re here to help you pick them.
Get started by checking out our Top 6 Stocks for this week. This is a curated list of our High Quality stocks that have generated a market-beating return of 175% over the last five years.
Stocks that made our list in 2019 include now familiar names such as Nvidia (+2,183% between December 2019 and December 2024) as well as under-the-radar businesses like Sterling Infrastructure (+1,096% five-year return). Find your next big winner with StockStory today for free.


