Since April 2025, BrightView has been in a holding pattern, posting a small loss of 1.3% while floating around $12.91. The stock also fell short of the S&P 500’s 29.3% gain during that period.
Is now the time to buy BrightView, or should you be careful about including it in your portfolio? See what our analysts have to say in our full research report, it’s free for active Edge members.
Why Do We Think BrightView Will Underperform?
We don't have much confidence in BrightView. Here are three reasons why BV doesn't excite us and a stock we'd rather own.
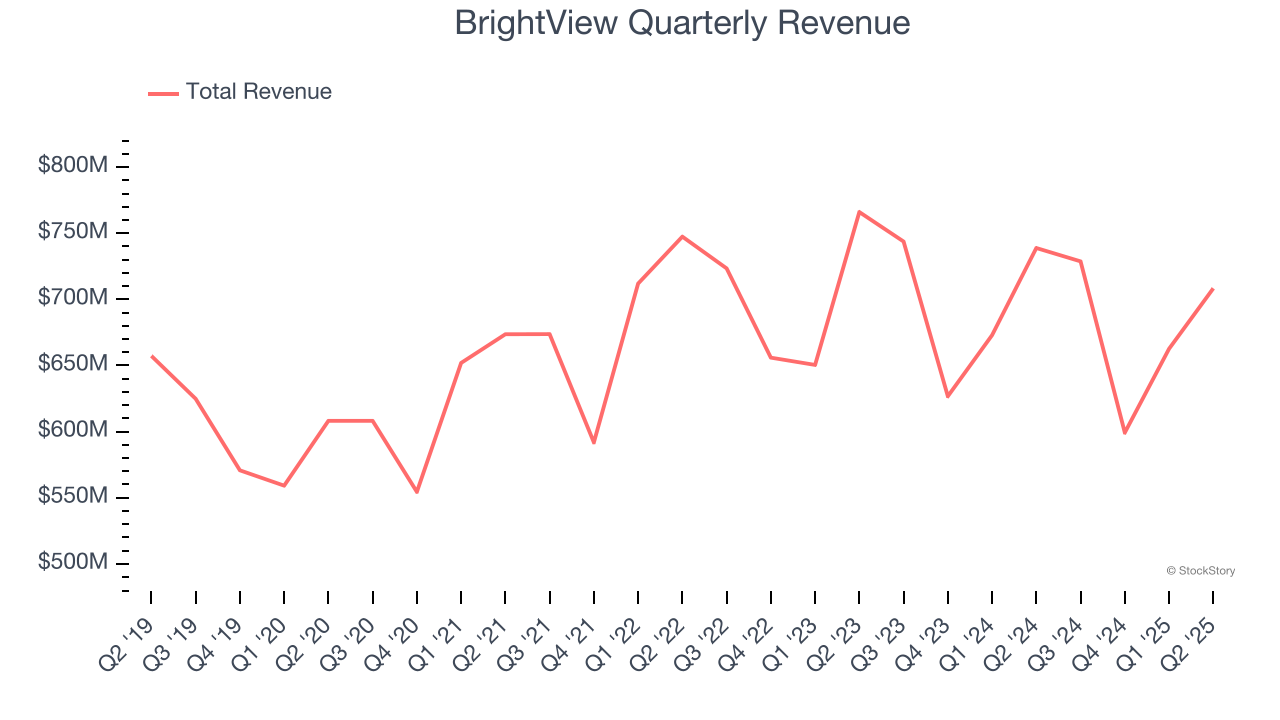
1. Long-Term Revenue Growth Disappoints
Examining a company’s long-term performance can provide clues about its quality. Any business can put up a good quarter or two, but many enduring ones grow for years. Over the last five years, BrightView grew its sales at a sluggish 2.7% compounded annual growth rate. This fell short of our benchmarks.
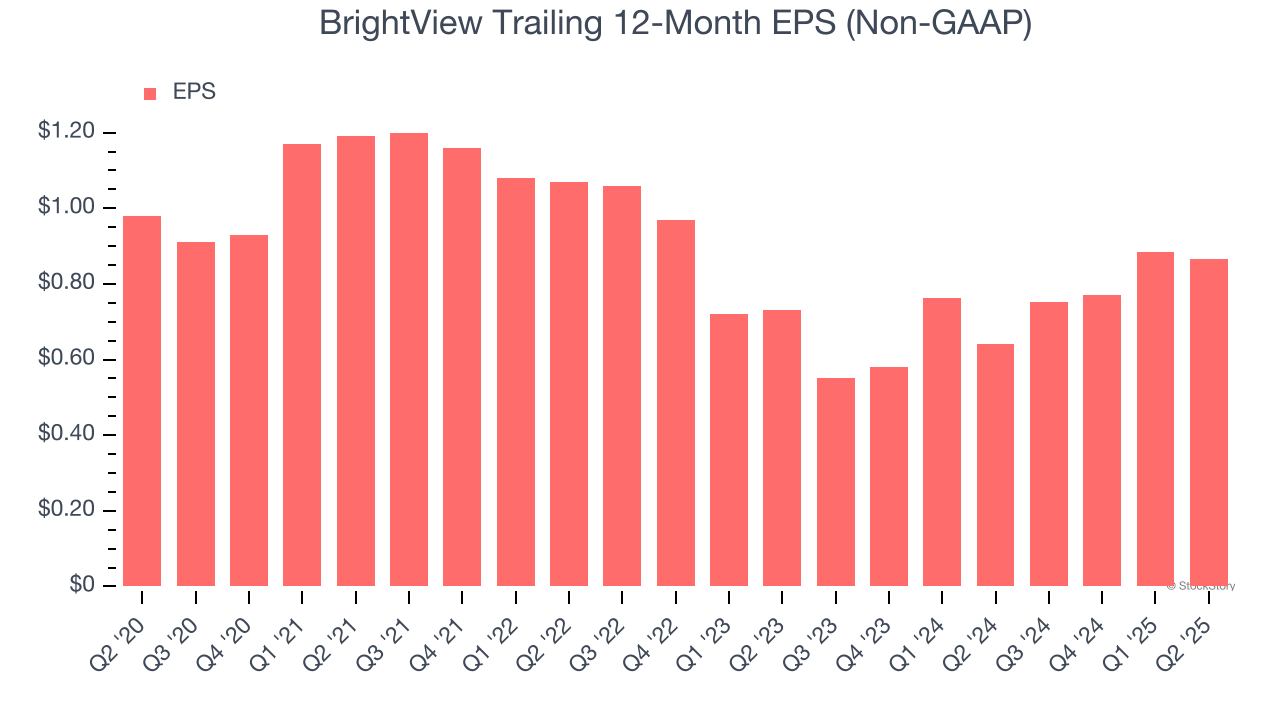
2. EPS Trending Down
Analyzing the long-term change in earnings per share (EPS) shows whether a company's incremental sales were profitable – for example, revenue could be inflated through excessive spending on advertising and promotions.
Sadly for BrightView, its EPS declined by 2.5% annually over the last five years while its revenue grew by 2.7%. This tells us the company became less profitable on a per-share basis as it expanded.
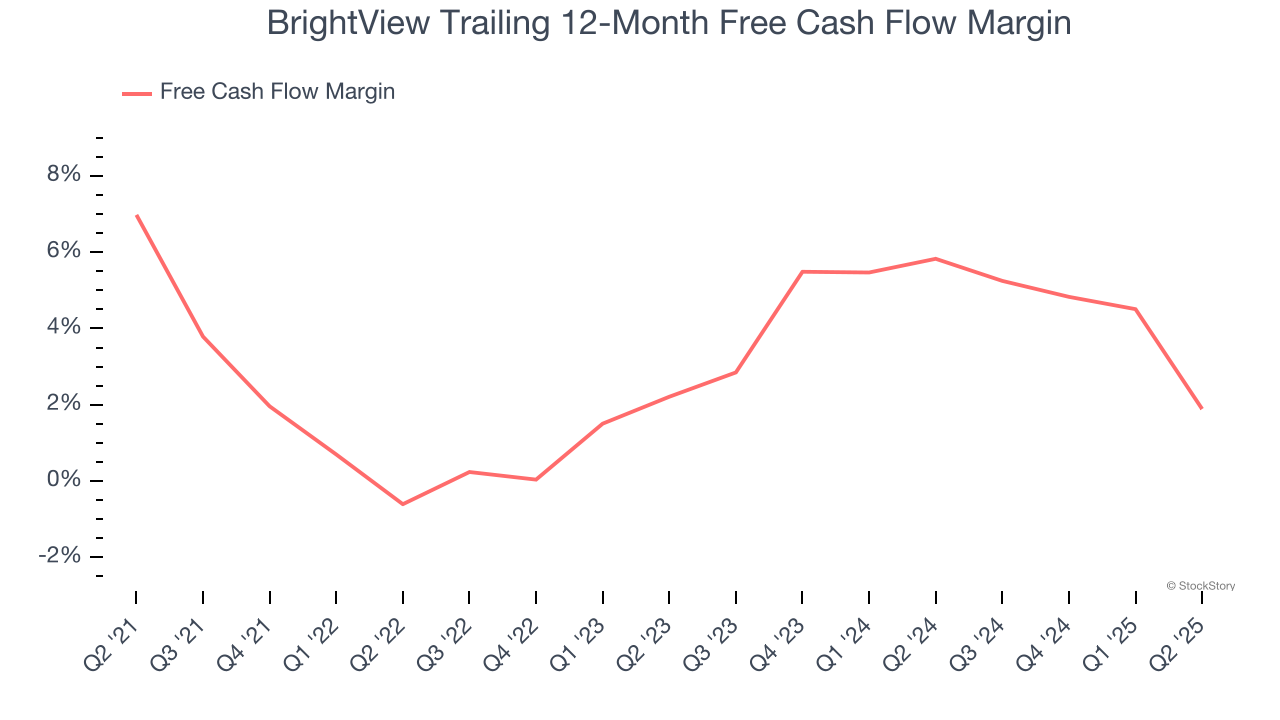
3. Free Cash Flow Margin Dropping
Free cash flow isn't a prominently featured metric in company financials and earnings releases, but we think it's telling because it accounts for all operating and capital expenses, making it tough to manipulate. Cash is king.
As you can see below, BrightView’s margin dropped by 5.1 percentage points over the last five years. This along with its unexciting margin put the company in a tough spot, and shareholders are likely hoping it can reverse course. If the trend continues, it could signal it’s becoming a more capital-intensive business. BrightView’s free cash flow margin for the trailing 12 months was 1.9%.
Final Judgment
We see the value of companies helping their customers, but in the case of BrightView, we’re out. With its shares lagging the market recently, the stock trades at 15.7× forward P/E (or $12.91 per share). This valuation is reasonable, but the company’s shaky fundamentals present too much downside risk. There are better stocks to buy right now. We’d suggest looking at one of Charlie Munger’s all-time favorite businesses.
Stocks We Like More Than BrightView
Donald Trump’s April 2025 "Liberation Day" tariffs sent markets into a tailspin, but stocks have since rebounded strongly, proving that knee-jerk reactions often create the best buying opportunities.
The smart money is already positioning for the next leg up. Don’t miss out on the recovery - check out our Top 6 Stocks for this week. This is a curated list of our High Quality stocks that have generated a market-beating return of 183% over the last five years (as of March 31st 2025).
Stocks that made our list in 2020 include now familiar names such as Nvidia (+1,545% between March 2020 and March 2025) as well as under-the-radar businesses like the once-micro-cap company Tecnoglass (+1,754% five-year return). Find your next big winner with StockStory today.
StockStory is growing and hiring equity analyst and marketing roles. Are you a 0 to 1 builder passionate about the markets and AI? See the open roles here.