
P10 currently trades at $10.70 per share and has shown little upside over the past six months, posting a middling return of 2.9%. The stock also fell short of the S&P 500’s 30.6% gain during that period.
Is now the time to buy PX? Find out in our full research report, it’s free for active Edge members.
Why Does PX Stock Spark Debate?
Operating as a bridge between institutional investors and hard-to-access private market opportunities, P10 (NYSE: PX) is an alternative asset management firm that provides access to private equity, venture capital, impact investing, and private credit opportunities in the middle and lower middle markets.
Two Things to Like:
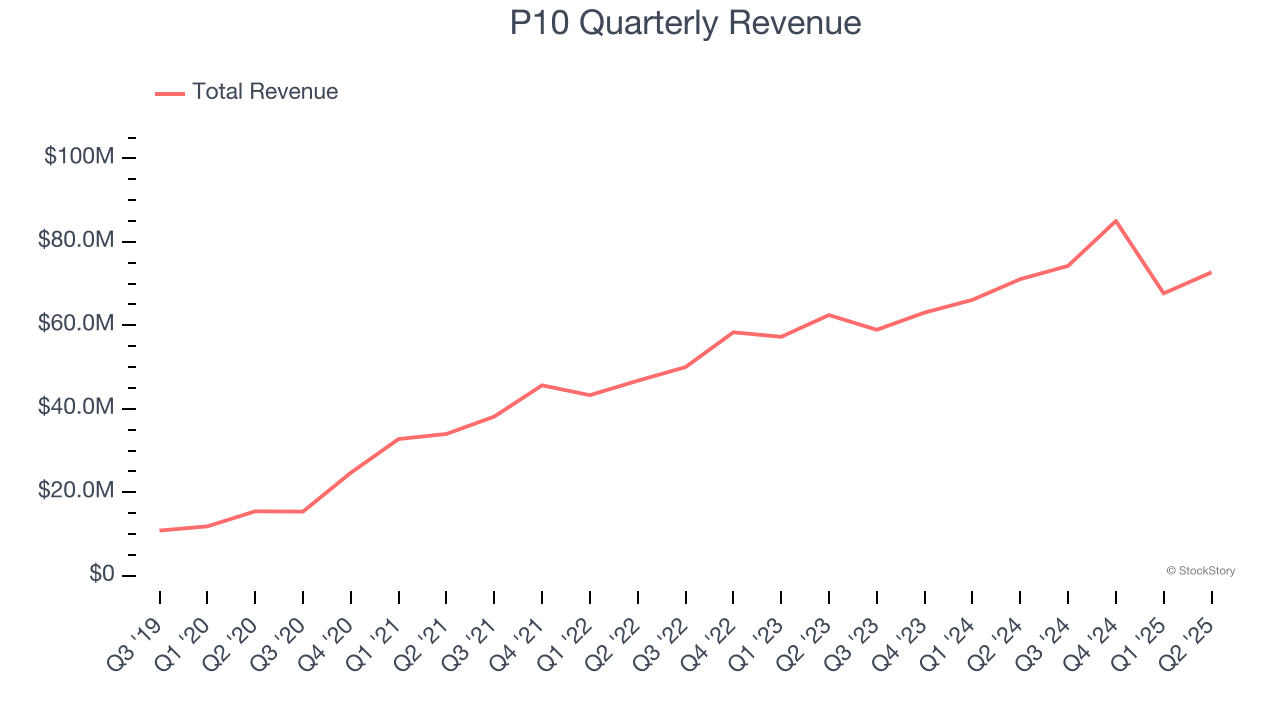
1. Skyrocketing Revenue Shows Strong Momentum
Reviewing a company’s long-term sales performance reveals insights into its quality. Any business can have short-term success, but a top-tier one grows for years.
Luckily, P10’s revenue grew at an incredible 41.3% compounded annual growth rate over the last five years. Its growth beat the average financials company and shows its offerings resonate with customers.
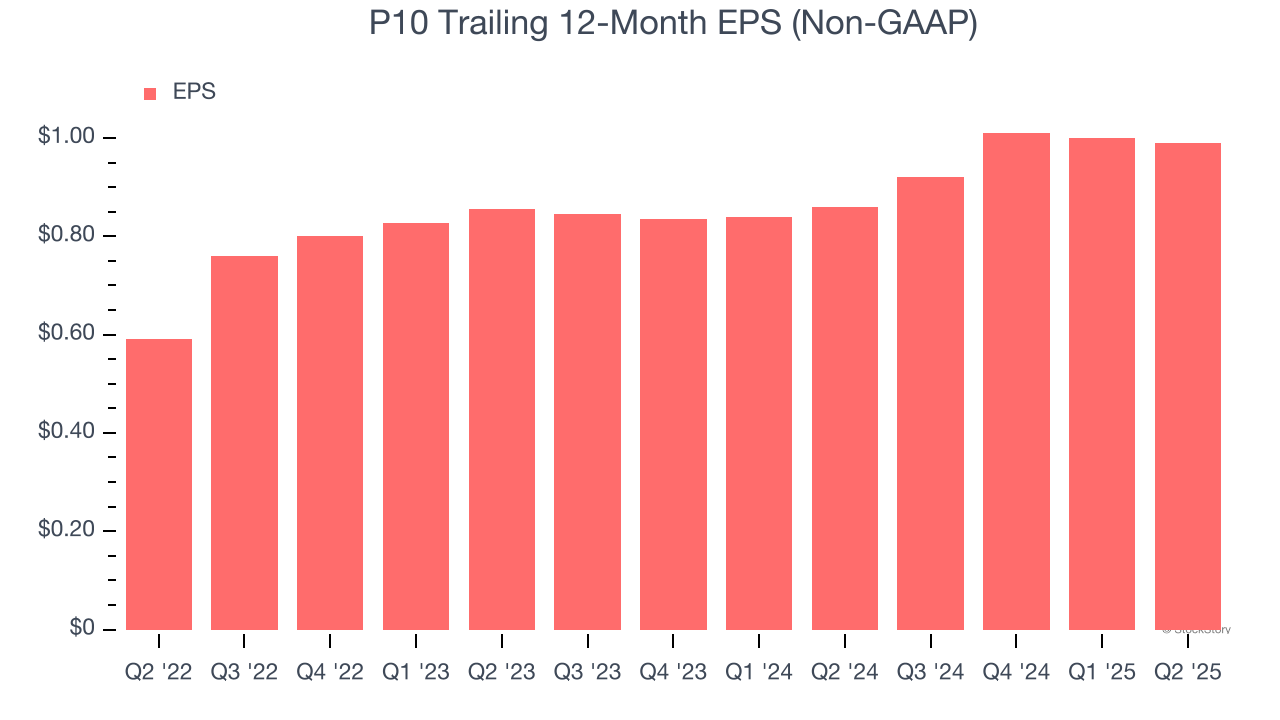
2. Outstanding Long-Term EPS Growth
Analyzing the change in earnings per share (EPS) shows whether a company's incremental sales were profitable – for example, revenue could be inflated through excessive spending on advertising and promotions.
P10’s full-year EPS grew at an astounding 36.5% compounded annual growth rate over the last three years, better than the broader financials sector.
One Reason to be Careful:
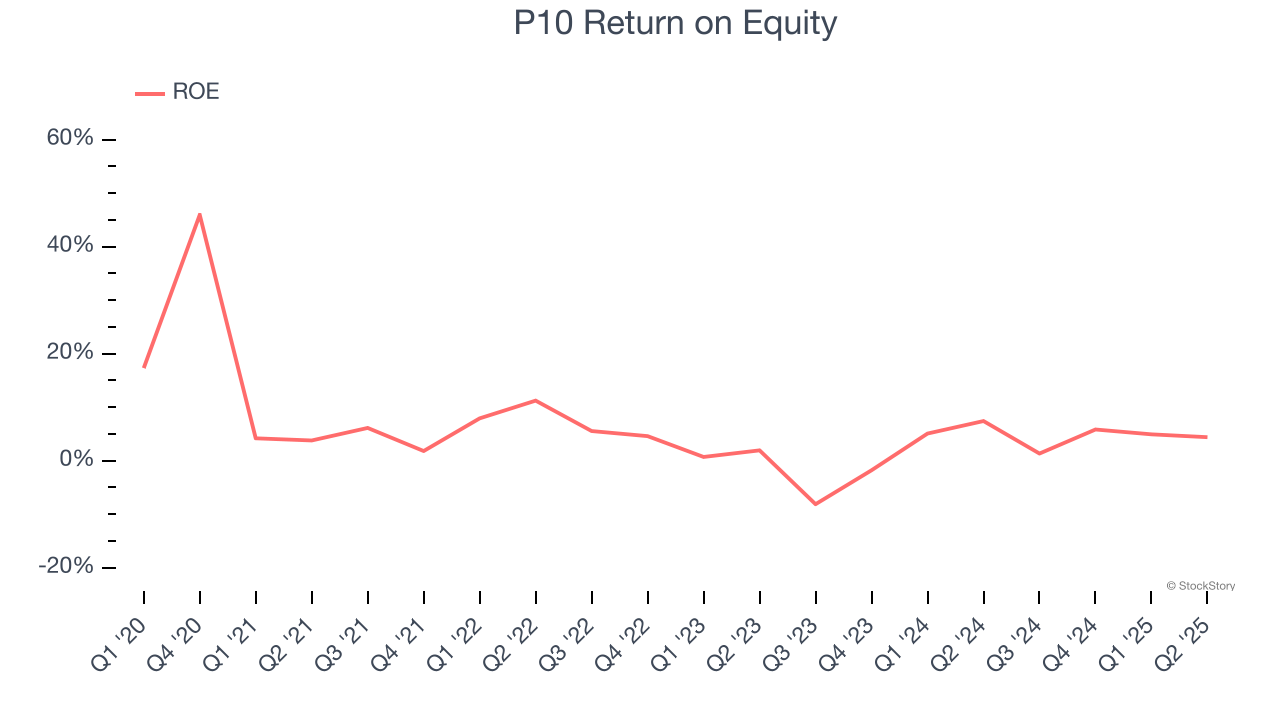
Previous Growth Initiatives Haven’t Impressed
Return on equity (ROE) measures how effectively banks generate profit from each dollar of shareholder equity - a critical funding source. High-ROE institutions typically compound shareholder wealth faster over time through retained earnings, share repurchases, and dividend payments.
Over the last five years, P10 has averaged an ROE of 5.9%, uninspiring for a company operating in a sector where the average shakes out around 10%. We’re optimistic P10 can turn the ship around given its success in other measures of financial health.
Final Judgment
P10’s positive characteristics outweigh the negatives. With its shares lagging the market recently, the stock trades at 10.8× forward P/E (or $10.70 per share). Is now a good time to initiate a position? See for yourself in our full research report, it’s free for active Edge members.
Stocks We Like Even More Than P10
Trump’s April 2025 tariff bombshell triggered a massive market selloff, but stocks have since staged an impressive recovery, leaving those who panic sold on the sidelines.
Take advantage of the rebound by checking out our Top 5 Growth Stocks for this month. This is a curated list of our High Quality stocks that have generated a market-beating return of 183% over the last five years (as of March 31st 2025).
Stocks that made our list in 2020 include now familiar names such as Nvidia (+1,545% between March 2020 and March 2025) as well as under-the-radar businesses like the once-small-cap company Exlservice (+354% five-year return). Find your next big winner with StockStory today.
StockStory is growing and hiring equity analyst and marketing roles. Are you a 0 to 1 builder passionate about the markets and AI? See the open roles here.