
Since April 2025, Banner Bank has been in a holding pattern, posting a small return of 2.8% while floating around $63.04. The stock also fell short of the S&P 500’s 27.3% gain during that period.
Does this present a buying opportunity for BANR? Or is its underperformance reflective of its story and business quality? Find out in our full research report, it’s free for active Edge members.
Why Does BANR Stock Spark Debate?
Founded in 1890 in Walla Walla, Washington, and evolving through more than a century of economic cycles, Banner Corporation (NASDAQ: BANR) operates Banner Bank, providing commercial banking services, loans, and financial products to individuals and businesses across Washington, Oregon, California, Idaho, and Utah.
Two Positive Attributes:
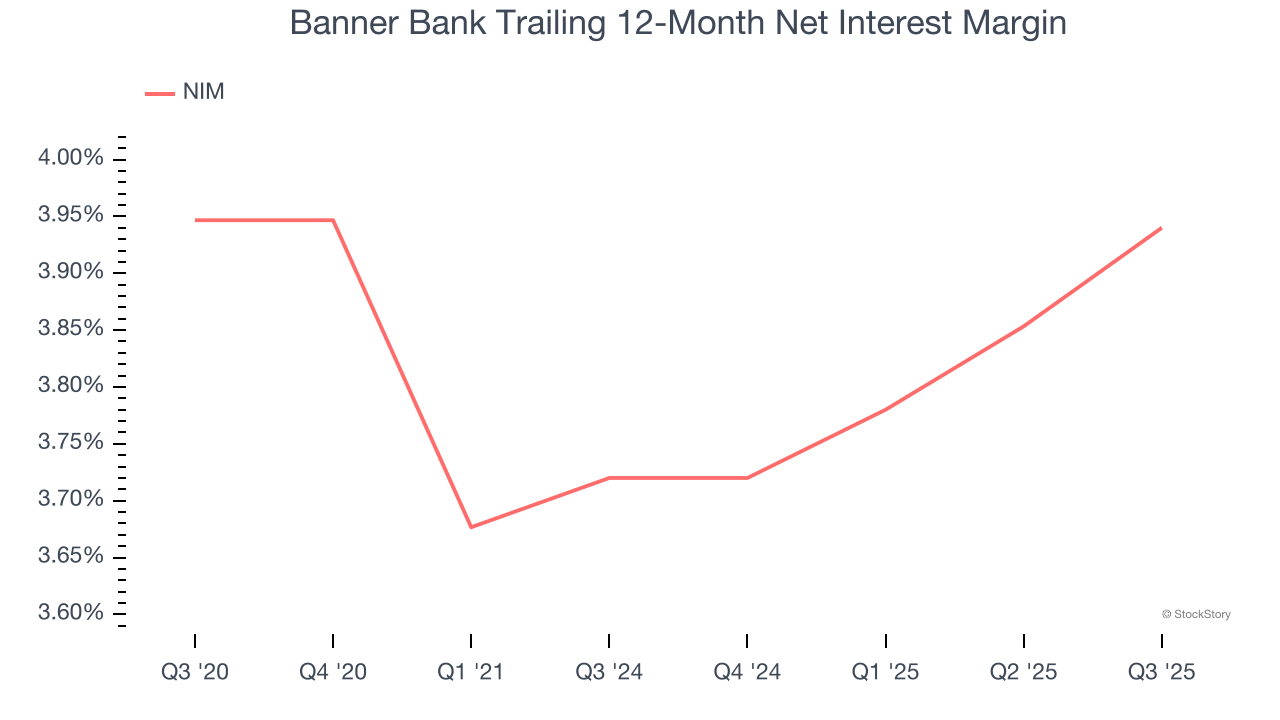
1. High Net Interest Margin Supports Loan Book Profitability
Net interest margin (NIM) represents the unit economics of a bank by measuring the profitability of its interest-bearing assets relative to its interest-bearing liabilities. It's a fundamental metric that investors use to assess lending premiums and returns.
Over the past two years, we can see that Banner Bank’s net interest margin averaged an impressive 3.8%. This indicates the company has strong unit economics and gives investors confidence in lending operations.
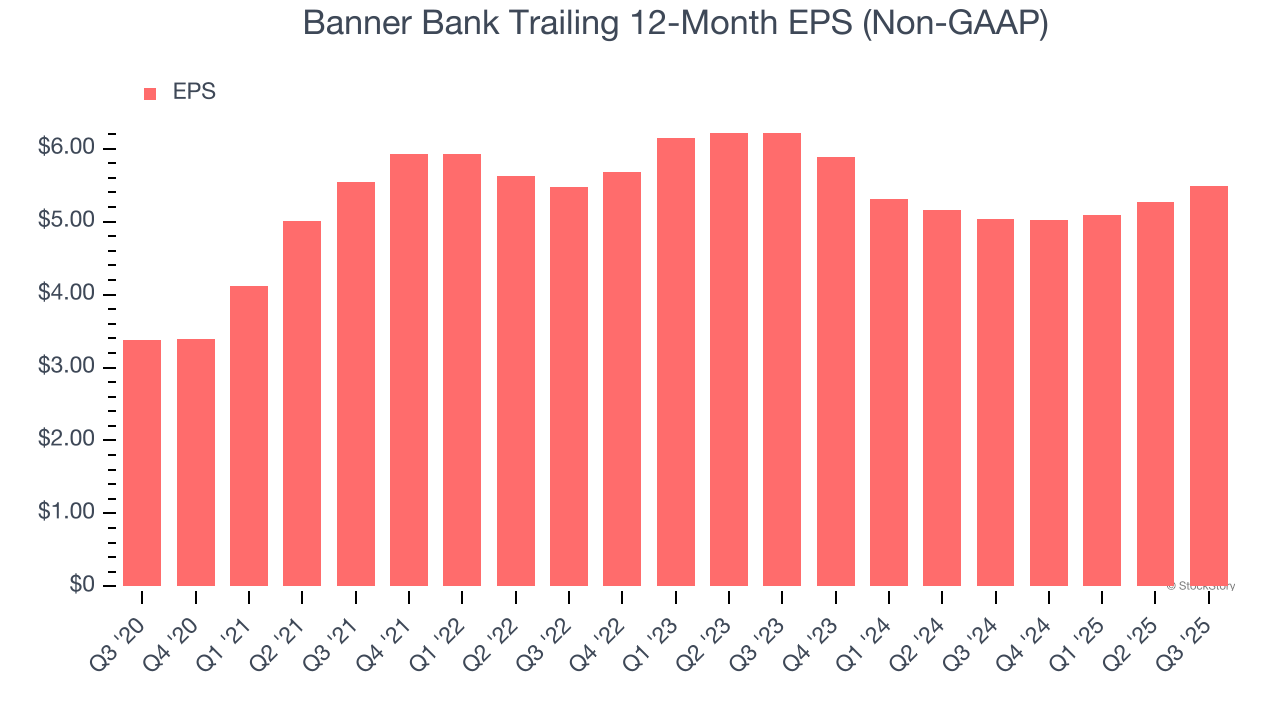
2. Outstanding Long-Term EPS Growth
We track the long-term change in earnings per share (EPS) because it highlights whether a company’s growth is profitable.
Banner Bank’s EPS grew at an astounding 10.2% compounded annual growth rate over the last five years, higher than its 2.8% annualized revenue growth. This tells us the company became more profitable on a per-share basis as it expanded.
One Reason to be Careful:
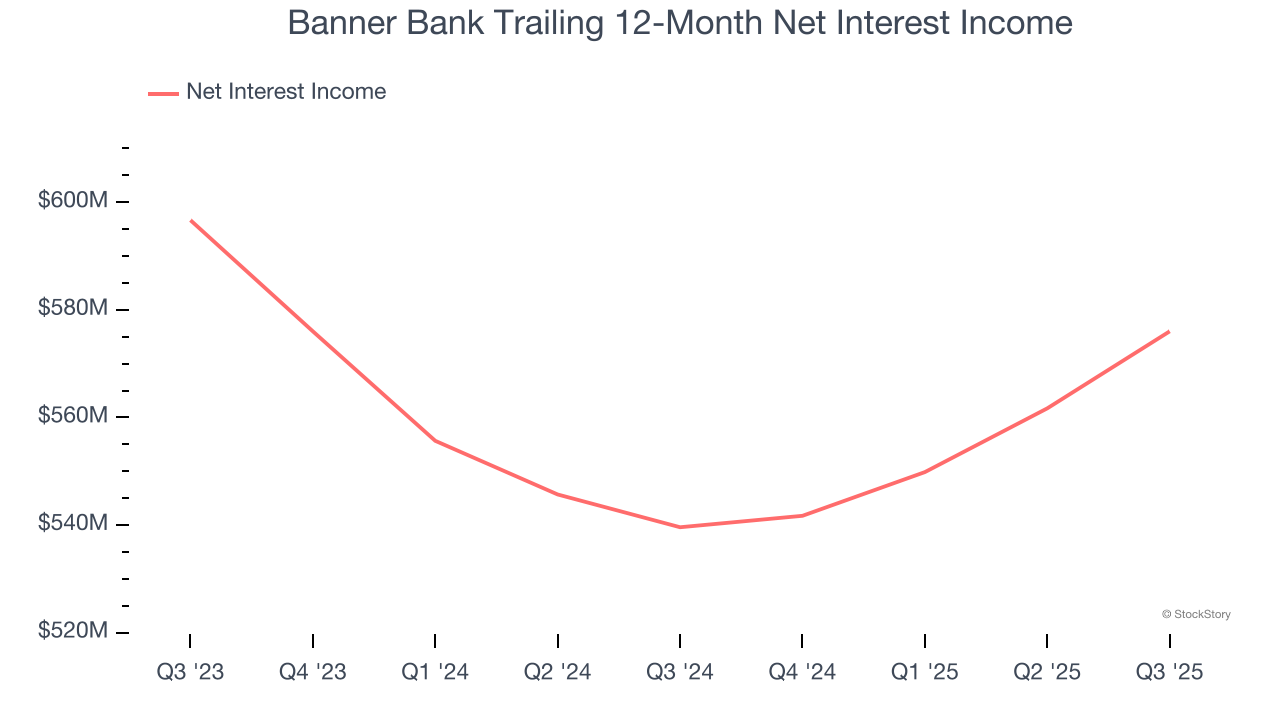
Net Interest Income Points to Soft Demand
Net interest income commands greater market attention due to its reliability and consistency, whereas one-time fees are often seen as lower-quality revenue that lacks the same dependable characteristics.
Banner Bank’s net interest income has grown at a 3.9% annualized rate over the last five years, worse than the broader banking industry. Its growth was driven by an increase in its outstanding loans as its net interest margin, which represents how much a bank earns in relation to its outstanding loan book, was flat throughout that period.
Final Judgment
Banner Bank’s merits more than compensate for its flaws. With its shares lagging the market recently, the stock trades at 1.1× forward P/B (or $63.04 per share). Is now a good time to buy? See for yourself in our full research report, it’s free for active Edge members.
Stocks We Like Even More Than Banner Bank
Trump’s April 2025 tariff bombshell triggered a massive market selloff, but stocks have since staged an impressive recovery, leaving those who panic sold on the sidelines.
Take advantage of the rebound by checking out our Top 6 Stocks for this week. This is a curated list of our High Quality stocks that have generated a market-beating return of 183% over the last five years (as of March 31st 2025).
Stocks that made our list in 2020 include now familiar names such as Nvidia (+1,545% between March 2020 and March 2025) as well as under-the-radar businesses like the once-micro-cap company Kadant (+351% five-year return). Find your next big winner with StockStory today.
StockStory is growing and hiring equity analyst and marketing roles. Are you a 0 to 1 builder passionate about the markets and AI? See the open roles here.