
Regional banking company City Holding (NASDAQ: CHCO) announced better-than-expected revenue in Q3 CY2025, with sales up 7% year on year to $81.26 million. Its GAAP profit of $2.41 per share was 11.8% above analysts’ consensus estimates.
Is now the time to buy City Holding? Find out by accessing our full research report, it’s free for active Edge members.
City Holding (CHCO) Q3 CY2025 Highlights:
- Net Interest Income: $61.11 million vs analyst estimates of $59.98 million (9.9% year-on-year growth, 1.9% beat)
- Net Interest Margin: 4% vs analyst estimates of 4% (9 basis point beat)
- Revenue: $81.26 million vs analyst estimates of $79.68 million (7% year-on-year growth, 2% beat)
- Efficiency Ratio: 46% vs analyst estimates of 49.3% (333.2 basis point beat)
- EPS (GAAP): $2.41 vs analyst estimates of $2.16 (11.8% beat)
- Tangible Book Value per Share: $44.19 vs analyst estimates of $42.96 (11.9% year-on-year growth, 2.9% beat)
- Market Capitalization: $1.74 billion
Company Overview
With roots dating back to 1957 and a strategic presence along the I-64 and I-81 corridors, City Holding (NASDAQGS:CHCO) operates as a financial holding company providing banking, trust, and investment services through its subsidiary City National Bank across West Virginia, Kentucky, Virginia, and Ohio.
Sales Growth
Two primary revenue streams drive bank earnings. While net interest income, which is earned by charging higher rates on loans than paid on deposits, forms the foundation, fee-based services across banking, credit, wealth management, and trading operations provide additional income. Over the last five years, City Holding grew its revenue at a decent 5.2% compounded annual growth rate. Its growth was slightly above the average banking company and shows its offerings resonate with customers.
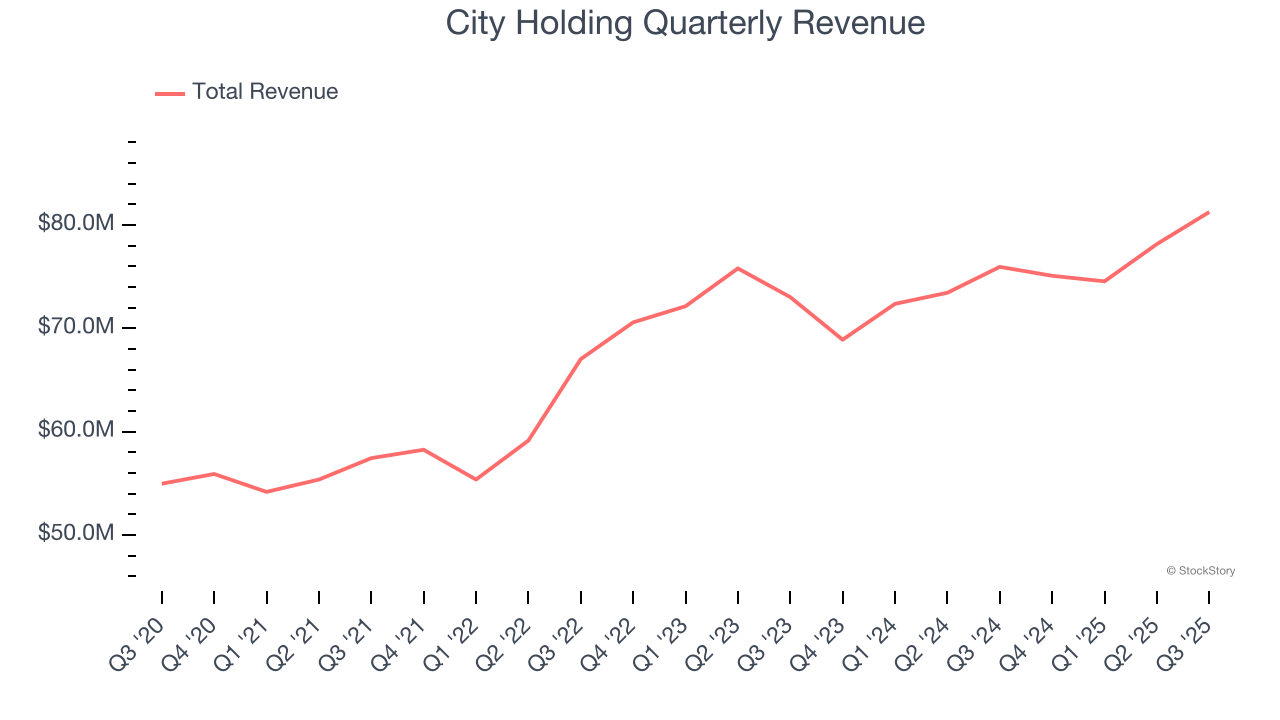
Long-term growth is the most important, but within financials, a half-decade historical view may miss recent interest rate changes and market returns. City Holding’s recent performance shows its demand has slowed as its annualized revenue growth of 3% over the last two years was below its five-year trend. 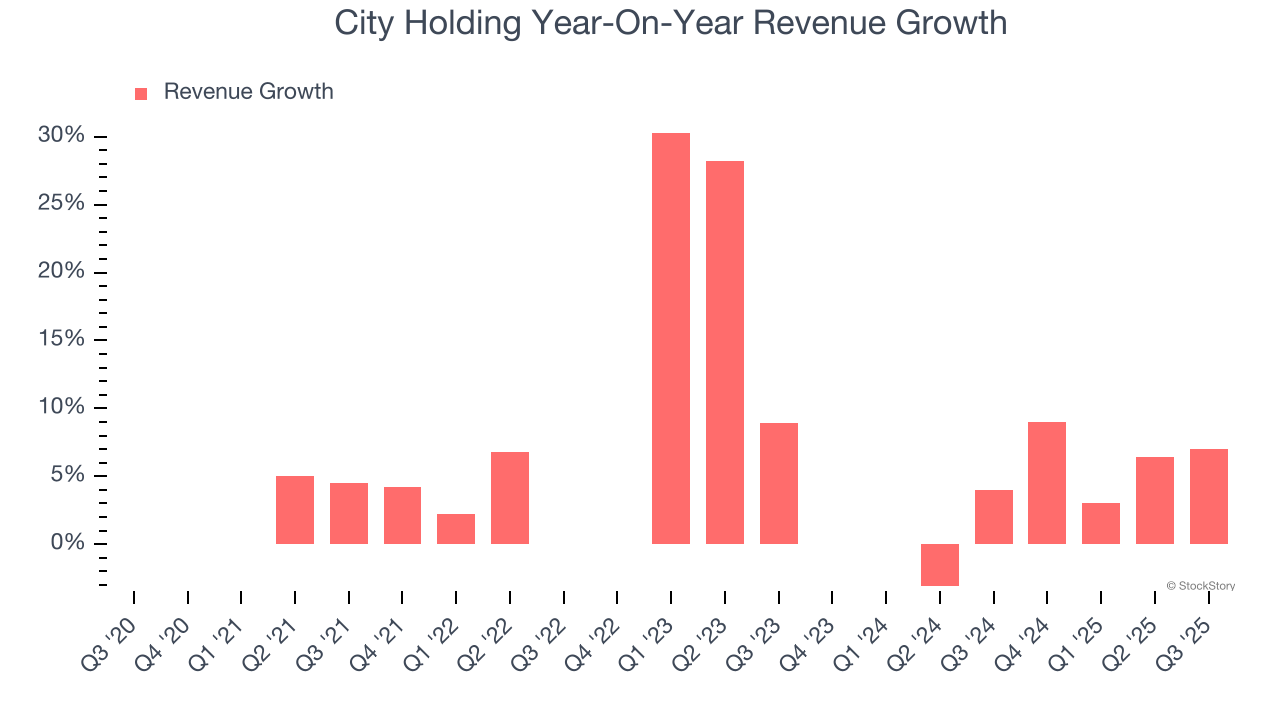 Note: Quarters not shown were determined to be outliers, impacted by outsized investment gains/losses that are not indicative of the recurring fundamentals of the business.
This quarter, City Holding reported year-on-year revenue growth of 7%, and its $81.26 million of revenue exceeded Wall Street’s estimates by 2%.
Net interest income made up 72.7% of the company’s total revenue during the last five years, meaning lending operations are City Holding’s largest source of revenue.
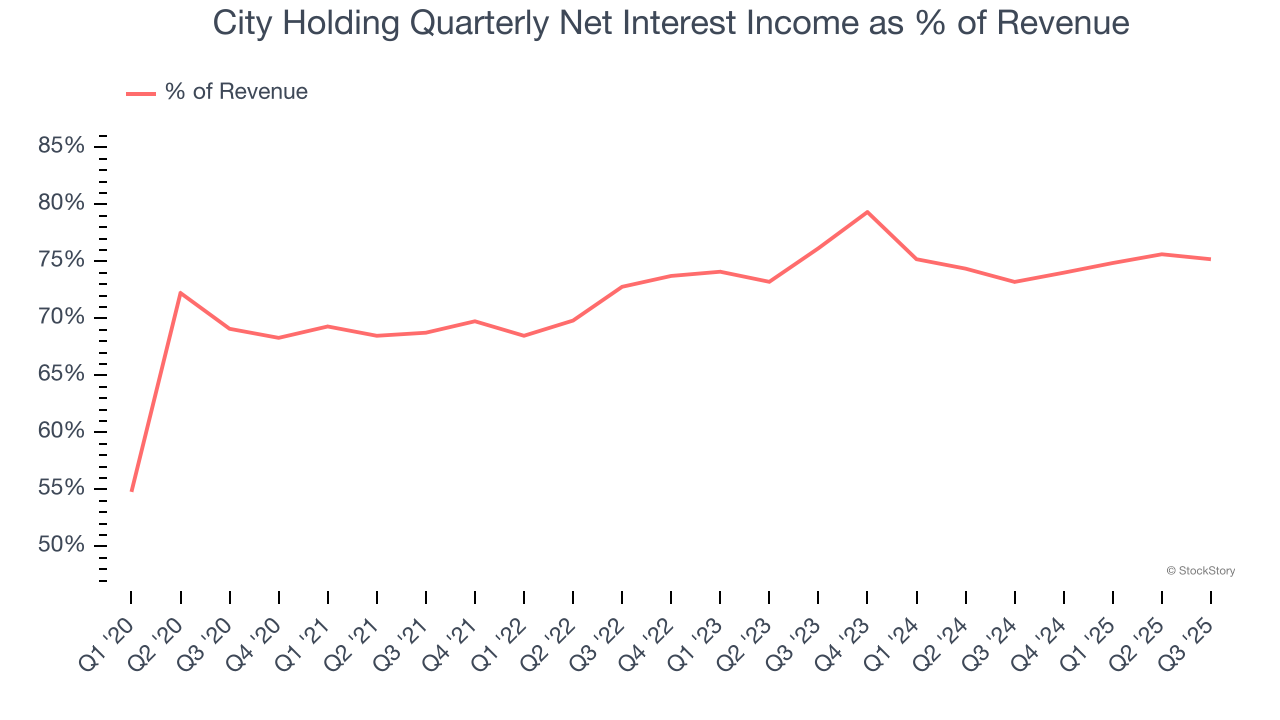
While banks generate revenue from multiple sources, investors view net interest income as the cornerstone - its predictable, recurring characteristics stand in sharp contrast to the volatility of non-interest income.
Unless you’ve been living under a rock, it should be obvious by now that generative AI is going to have a huge impact on how large corporations do business. While Nvidia and AMD are trading close to all-time highs, we prefer a lesser-known (but still profitable) stock benefiting from the rise of AI. Click here to access our free report one of our favorites growth stories.
Tangible Book Value Per Share (TBVPS)
The balance sheet drives banking profitability since earnings flow from the spread between borrowing and lending rates. As such, valuations for these companies concentrate on capital strength and sustainable equity accumulation potential.
Because of this, tangible book value per share (TBVPS) emerges as the critical performance benchmark. By excluding intangible assets with uncertain liquidation values, this metric captures real, liquid net worth per share. Traditional metrics like EPS are helpful but face distortion from M&A activity and loan loss accounting rules.
City Holding’s TBVPS grew at a mediocre 4.1% annual clip over the last five years. However, TBVPS growth has accelerated recently, growing by 21.4% annually over the last two years from $29.98 to $44.19 per share.
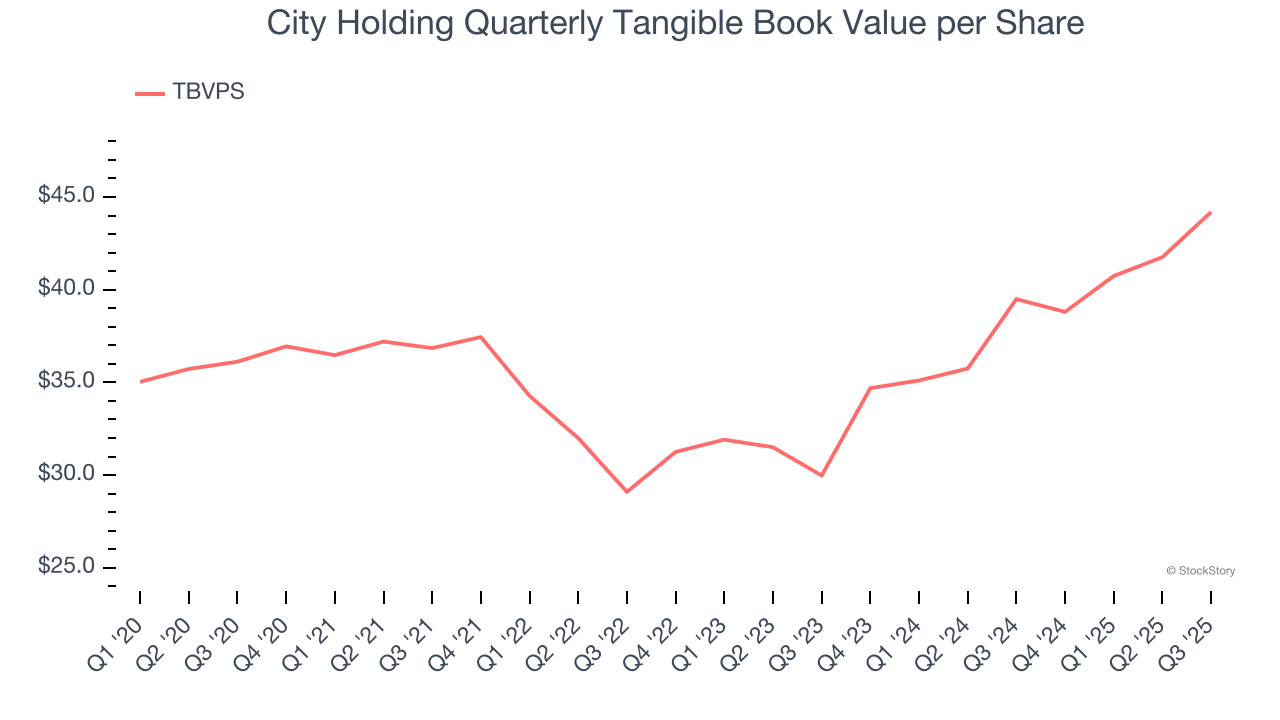
Over the next 12 months, Consensus estimates call for City Holding’s TBVPS to grow by 6.7% to $47.13, mediocre growth rate.
Key Takeaways from City Holding’s Q3 Results
We enjoyed seeing City Holding beat analysts’ tangible book value per share expectations this quarter. We were also glad its EPS outperformed Wall Street’s estimates. Overall, we think this was a solid quarter with some key areas of upside. The stock traded up 1.8% to $122.41 immediately after reporting.
Sure, City Holding had a solid quarter, but if we look at the bigger picture, is this stock a buy? What happened in the latest quarter matters, but not as much as longer-term business quality and valuation, when deciding whether to invest in this stock. We cover that in our actionable full research report which you can read here, it’s free for active Edge members.


