Midwest regional bank QCR Holdings (NASDAQGM:QCRH) reported revenue ahead of Wall Street’s expectations in Q3 CY2025, with sales up 4.3% year on year to $101.5 million. Its non-GAAP profit of $2.17 per share was 25.1% above analysts’ consensus estimates.
Is now the time to buy QCR Holdings? Find out by accessing our full research report, it’s free for active Edge members.
QCR Holdings (QCRH) Q3 CY2025 Highlights:
- Net Interest Income: $64.8 million vs analyst estimates of $64.43 million (8.5% year-on-year growth, 0.6% beat)
- Net Interest Margin: 3% vs analyst estimates of 3.5% (48 basis point miss)
- Revenue: $101.5 million vs analyst estimates of $90.78 million (4.3% year-on-year growth, 11.8% beat)
- Efficiency Ratio: 55.8% vs analyst estimates of 54.6% (118.2 basis point miss)
- Adjusted EPS: $2.17 vs analyst estimates of $1.74 (25.1% beat)
- Tangible Book Value per Share: $55.78 vs analyst estimates of $55.14 (13.8% year-on-year growth, 1.2% beat)
- Market Capitalization: $1.21 billion
Company Overview
With roots dating back to 1993 and a name reflecting its original Quad Cities market, QCR Holdings (NASDAQGM:QCRH) operates four community banks across Iowa and Missouri, providing commercial, consumer banking, and trust services to businesses and individuals.
Sales Growth
Net interest income and and fee-based revenue are the two pillars supporting bank earnings. The former captures profit from the gap between lending rates and deposit costs, while the latter encompasses charges for banking services, credit products, wealth management, and trading activities. Over the last five years, QCR Holdings grew its revenue at a decent 5.5% compounded annual growth rate. Its growth was slightly above the average banking company and shows its offerings resonate with customers.
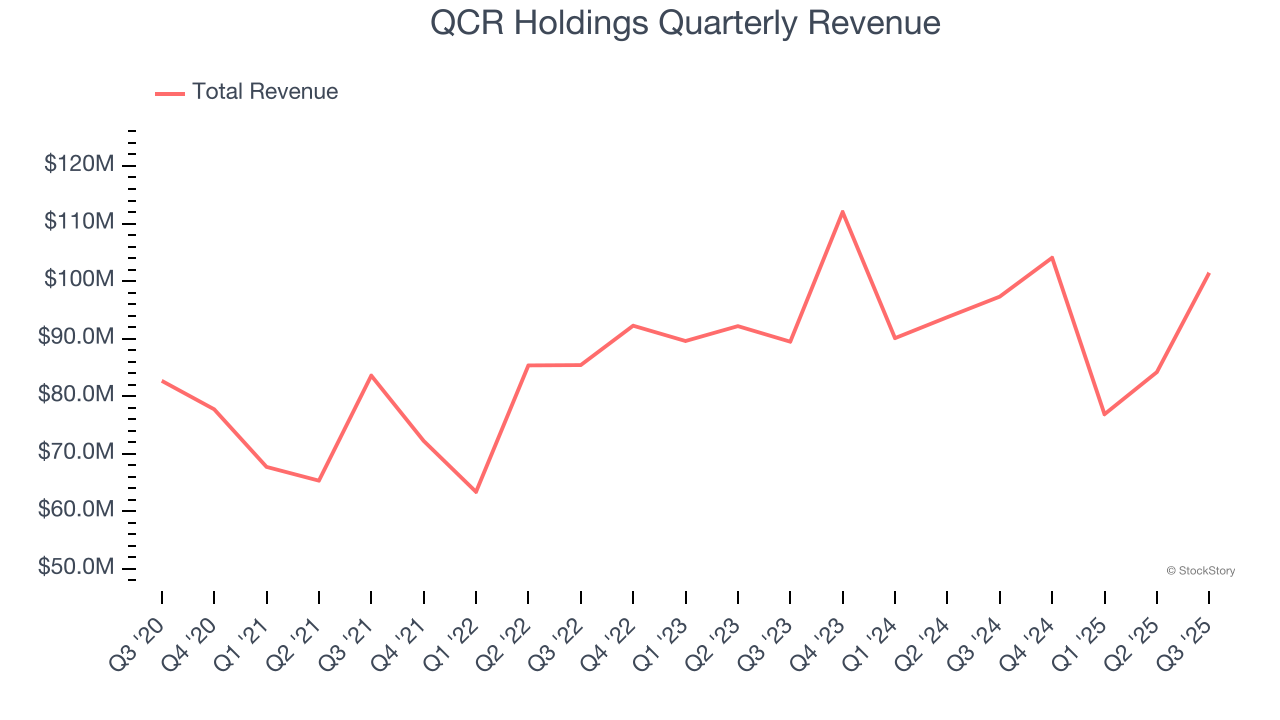
We at StockStory place the most emphasis on long-term growth, but within financials, a half-decade historical view may miss recent interest rate changes, market returns, and industry trends. QCR Holdings’s recent performance shows its demand has slowed as its revenue was flat over the last two years. 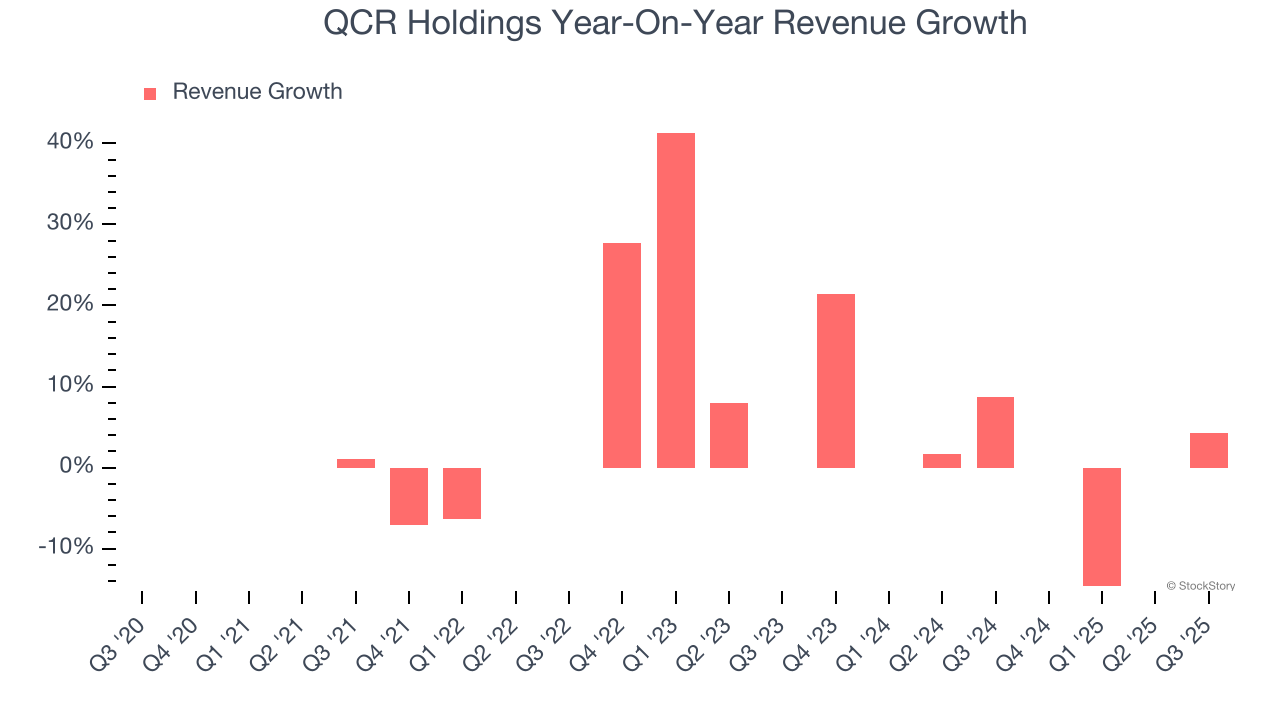 Note: Quarters not shown were determined to be outliers, impacted by outsized investment gains/losses that are not indicative of the recurring fundamentals of the business.
This quarter, QCR Holdings reported modest year-on-year revenue growth of 4.3% but beat Wall Street’s estimates by 11.8%.
Net interest income made up 63.9% of the company’s total revenue during the last five years, meaning lending operations are QCR Holdings’s largest source of revenue.
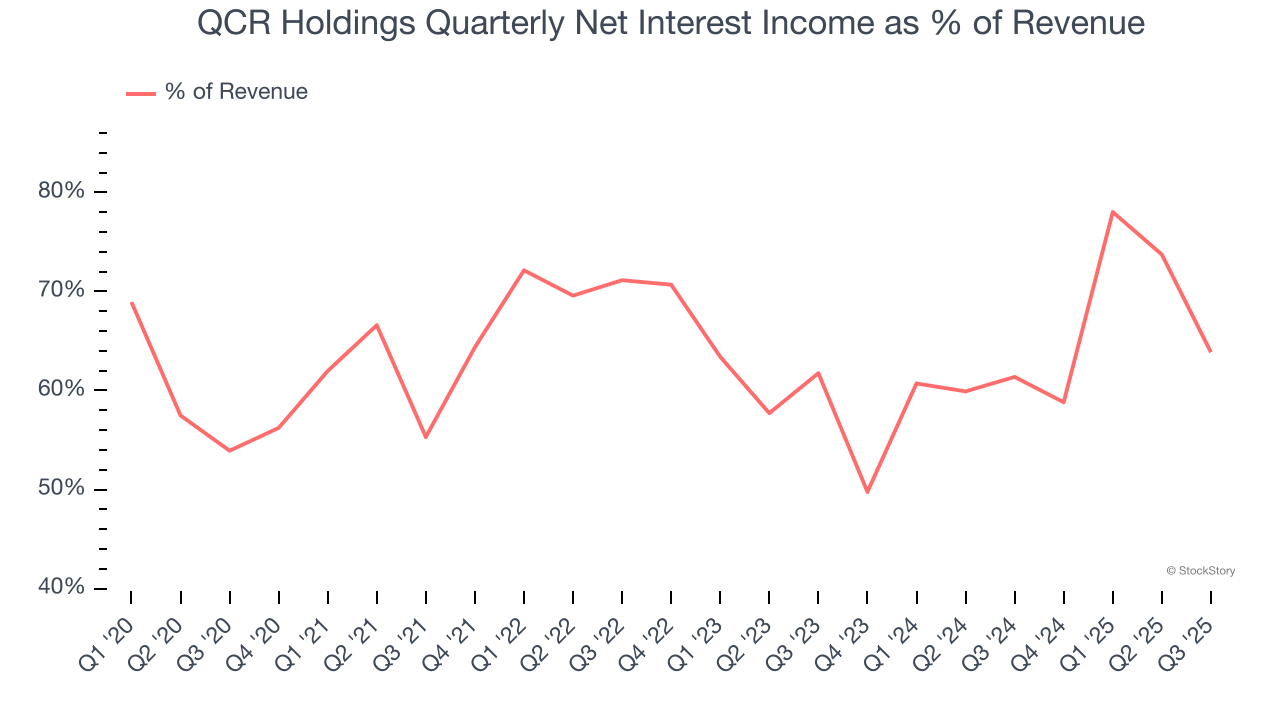
Our experience and research show the market cares primarily about a bank’s net interest income growth as non-interest income is considered a lower-quality and non-recurring revenue source.
Software is eating the world and there is virtually no industry left that has been untouched by it. That drives increasing demand for tools helping software developers do their jobs, whether it be monitoring critical cloud infrastructure, integrating audio and video functionality, or ensuring smooth content streaming. Click here to access a free report on our 3 favorite stocks to play this generational megatrend.
Tangible Book Value Per Share (TBVPS)
The balance sheet drives banking profitability since earnings flow from the spread between borrowing and lending rates. As such, valuations for these companies concentrate on capital strength and sustainable equity accumulation potential.
When analyzing banks, tangible book value per share (TBVPS) takes precedence over many other metrics. This measure isolates genuine per-share value by removing intangible assets of debatable liquidation worth. EPS can become murky due to acquisition impacts or accounting flexibility around loan provisions, and TBVPS resists financial engineering manipulation.
QCR Holdings’s TBVPS grew at an incredible 12.6% annual clip over the last five years. TBVPS growth has also accelerated recently, growing by 17.6% annually over the last two years from $40.33 to $55.78 per share.
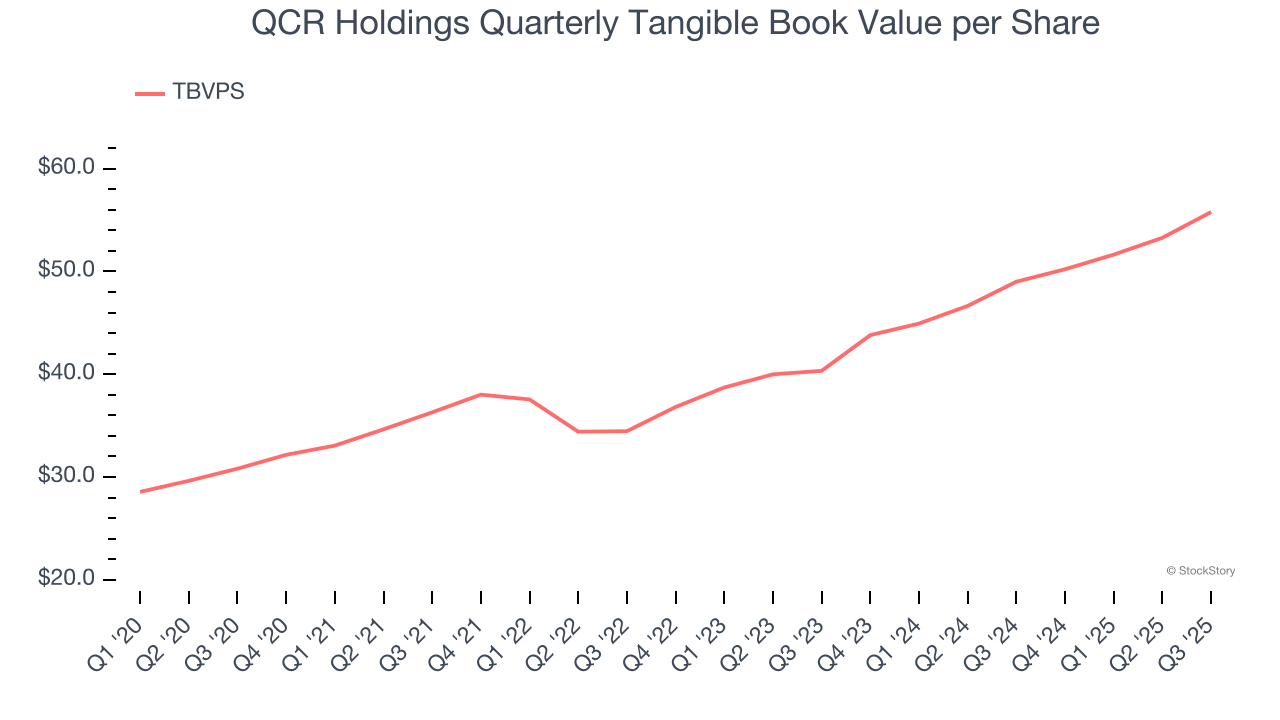
Over the next 12 months, Consensus estimates call for QCR Holdings’s TBVPS to grow by 12.3% to $62.67, top-notch growth rate.
Key Takeaways from QCR Holdings’s Q3 Results
It was good to see QCR Holdings beat analysts’ EPS expectations this quarter. We were also excited its revenue outperformed Wall Street’s estimates by a wide margin. Zooming out, we think this was a solid print. The stock remained flat at $71.49 immediately after reporting.
QCR Holdings put up rock-solid earnings, but one quarter doesn’t necessarily make the stock a buy. Let’s see if this is a good investment. What happened in the latest quarter matters, but not as much as longer-term business quality and valuation, when deciding whether to invest in this stock. We cover that in our actionable full research report which you can read here, it’s free for active Edge members.


