The past six months have been a windfall for SPX Technologies’s shareholders. The company’s stock price has jumped 51.5%, hitting $191.84 per share. This was partly due to its solid quarterly results, and the run-up might have investors contemplating their next move.
Is it too late to buy SPXC? Find out in our full research report, it’s free for active Edge members.
Why Are We Positive On SPXC?
With roots dating back to 1912 as the Piston Ring Company, SPX Technologies (NYSE: SPXC) supplies specialized infrastructure equipment for HVAC systems and detection and measurement applications across industrial, commercial, and utility markets.
1. Skyrocketing Revenue Shows Strong Momentum
Long-term growth is the most important, but within industrials, a stretched historical view may miss new industry trends or demand cycles. SPX Technologies’s annualized revenue growth of 12.5% over the last two years is above its five-year trend, suggesting its demand recently accelerated. 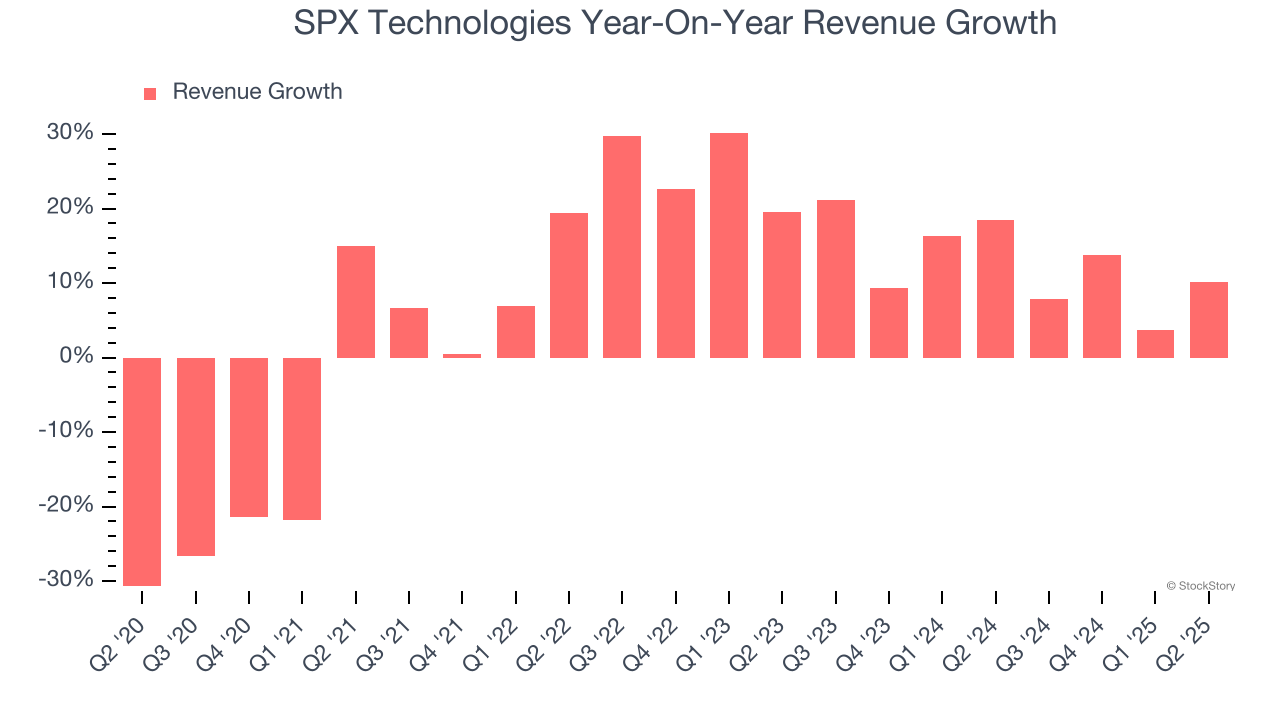
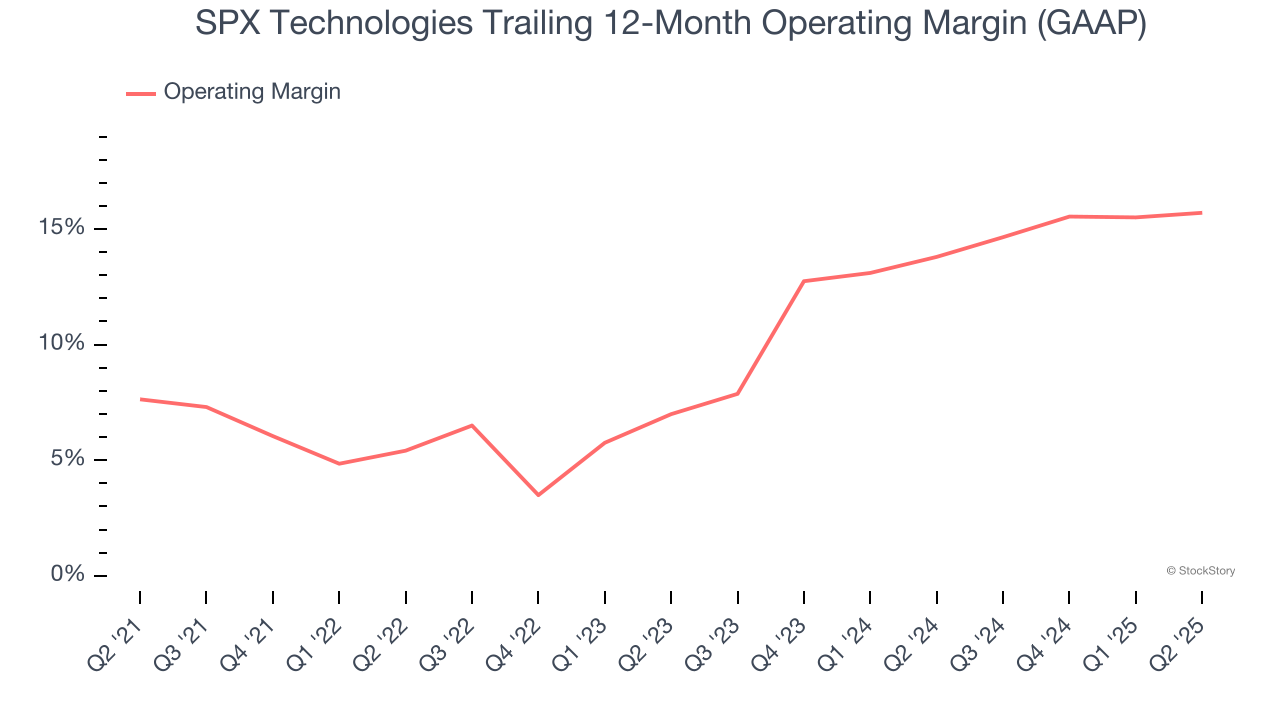
2. Operating Margin Rising, Profits Up
Operating margin is one of the best measures of profitability because it tells us how much money a company takes home after procuring and manufacturing its products, marketing and selling those products, and most importantly, keeping them relevant through research and development.
Analyzing the trend in its profitability, SPX Technologies’s operating margin rose by 8.1 percentage points over the last five years, as its sales growth gave it operating leverage. Its operating margin for the trailing 12 months was 15.7%.
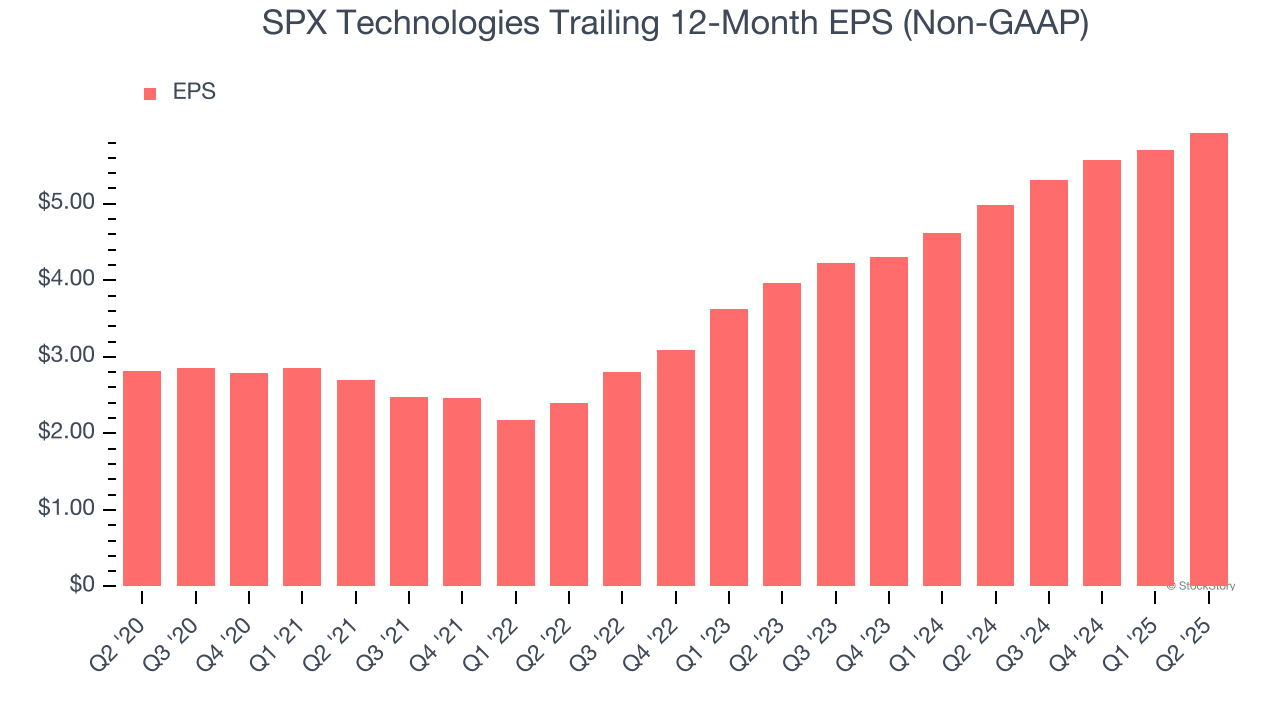
3. Outstanding Long-Term EPS Growth
We track the long-term change in earnings per share (EPS) because it highlights whether a company’s growth is profitable.
SPX Technologies’s EPS grew at a spectacular 16% compounded annual growth rate over the last five years, higher than its 7.4% annualized revenue growth. This tells us the company became more profitable on a per-share basis as it expanded.
Final Judgment
These are just a few reasons why SPX Technologies ranks highly on our list, and after the recent rally, the stock trades at 27.9× forward P/E (or $191.84 per share). Is now a good time to buy? See for yourself in our in-depth research report, it’s free for active Edge members.
Stocks We Like Even More Than SPX Technologies
When Trump unveiled his aggressive tariff plan in April 2025, markets tanked as investors feared a full-blown trade war. But those who panicked and sold missed the subsequent rebound that’s already erased most losses.
Don’t let fear keep you from great opportunities and take a look at Top 6 Stocks for this week. This is a curated list of our High Quality stocks that have generated a market-beating return of 183% over the last five years (as of March 31st 2025).
Stocks that made our list in 2020 include now familiar names such as Nvidia (+1,545% between March 2020 and March 2025) as well as under-the-radar businesses like the once-micro-cap company Kadant (+351% five-year return). Find your next big winner with StockStory today.
StockStory is growing and hiring equity analyst and marketing roles. Are you a 0 to 1 builder passionate about the markets and AI? See the open roles here.